6 Morgan Rd Mansfield, MA 02048
Estimated Value: $529,000 - $621,000
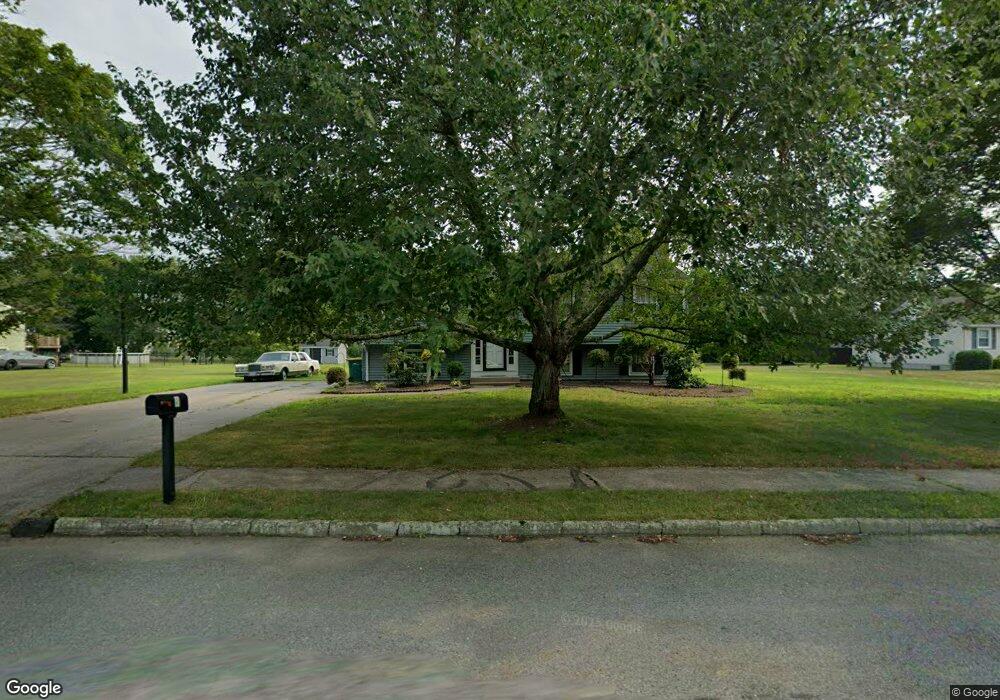
About This Home
This home is located at 6 Morgan Rd, Mansfield, MA 02048 and is currently estimated at $570,728, approximately $528 per square foot. 6 Morgan Rd is a home located in Bristol County with nearby schools including Everett W. Robinson Elementary School, Jordan/Jackson Elementary School, and Harold L. Qualters Middle School.
Ownership History
We collect this data history from publicly available records. To have your information removed, we recommend requesting removal directly through your county’s website.
Purchase Details
Home Values in the Area
Average Home Value in this Area
Purchase History
We collect this data history from publicly available records. To have your information removed, we recommend requesting removal directly through your county’s website.
| Date | Buyer | Sale Price | Title Company |
|---|---|---|---|
| -- | -- |
Mortgage History
We collect this data history from publicly available records. To have your information removed, we recommend requesting removal directly through your county’s website.
| Date | Status | Borrower | Loan Amount |
|---|---|---|---|
| Closed | $302,197 | ||
| Closed | $254,375 | ||
| Closed | $202,514 | ||
| Closed | $152,250 | ||
| Closed | $49,900 |
Tax History
We collect this data history from publicly available records. To have your information removed, we recommend requesting removal directly through your county’s website.
| Year | Tax Paid | Tax Assessment Tax Assessment Total Assessment is a certain percentage of the fair market value that is determined by local assessors to be the total taxable value of land and additions on the property. | Land | Improvement |
|---|---|---|---|---|
| 2025 | $6,805 | $516,700 | $266,000 | $250,700 |
| 2024 | $6,390 | $473,300 | $253,900 | $219,400 |
| 2023 | $6,273 | $445,200 | $253,900 | $191,300 |
| 2022 | $6,089 | $401,400 | $235,000 | $166,400 |
| 2021 | $2,953 | $388,300 | $223,900 | $164,400 |
| 2020 | $2,887 | $364,600 | $195,900 | $168,700 |
| 2019 | $5,406 | $355,200 | $186,500 | $168,700 |
| 2018 | $2,585 | $333,600 | $177,800 | $155,800 |
| 2017 | $4,978 | $331,400 | $172,800 | $158,600 |
| 2016 | $4,765 | $309,200 | $164,500 | $144,700 |
| 2015 | $4,480 | $289,000 | $164,500 | $124,500 |
Map
- 8 Douglas Dr
- 100 Lakeview Ave
- 85 Jewell St
- 9 Green St
- 8 Bicknell St
- 139 Grove St
- 80 S Grove St
- 87 Messenger St
- 84 Messenger St
- 16 Coach Rd
- 40 Treasure Island Rd
- 401 South St
- 1125 School St
- 110 Raymond Hall Dr
- 18 Taunton St Unit 34
- 23 Dinny Ln
- 92 Horace Darling Dr
- 25 Old Wood Rd
- 4 Wagon Wheel Rd
- 38 West St
Ask me questions while you tour the home.