6 Ripley Rd Cohasset, MA 02025
Cohasset AreaEstimated Value: $1,298,000 - $1,764,652
About This Home
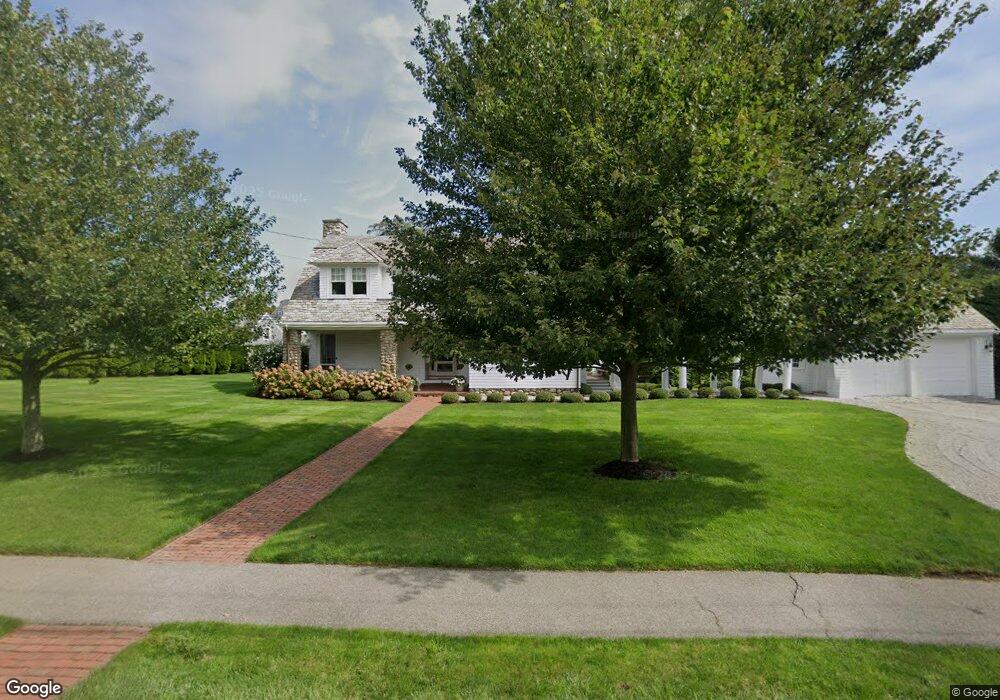
This home is located at 6 Ripley Rd, Cohasset, MA 02025 and is currently estimated at $1,597,413, approximately $462 per square foot. 6 Ripley Rd is a home located in Norfolk County with nearby schools including Joseph Osgood School, Deer Hill School, and Cohasset Middle School.
Ownership History
We collect this data history from publicly available records. To have your information removed, we recommend requesting removal directly through your county’s website.
Purchase Details
Purchase Details
Purchase Details
Home Values in the Area
Average Home Value in this Area
Purchase History
We collect this data history from publicly available records. To have your information removed, we recommend requesting removal directly through your county’s website.
| Date | Buyer | Sale Price | Title Company |
|---|---|---|---|
| -- | -- | ||
| -- | -- | ||
| $270,000 | -- |
Mortgage History
We collect this data history from publicly available records. To have your information removed, we recommend requesting removal directly through your county’s website.
| Date | Status | Borrower | Loan Amount |
|---|---|---|---|
| Previous Owner | $335,000 | ||
| Previous Owner | $370,000 | ||
| Previous Owner | $150,000 | ||
| Previous Owner | $100,000 | ||
| Previous Owner | $450,000 | ||
| Previous Owner | $435,000 | ||
| Previous Owner | $390,000 |
Tax History
We collect this data history from publicly available records. To have your information removed, we recommend requesting removal directly through your county’s website.
| Year | Tax Paid | Tax Assessment Tax Assessment Total Assessment is a certain percentage of the fair market value that is determined by local assessors to be the total taxable value of land and additions on the property. | Land | Improvement |
|---|---|---|---|---|
| 2025 | $14,049 | $1,213,200 | $485,600 | $727,600 |
| 2024 | $13,718 | $1,127,200 | $388,500 | $738,700 |
| 2023 | $13,299 | $1,127,000 | $388,300 | $738,700 |
| 2022 | $13,140 | $1,046,200 | $388,300 | $657,900 |
| 2021 | $12,933 | $991,800 | $388,300 | $603,500 |
| 2020 | $12,864 | $991,800 | $388,300 | $603,500 |
| 2019 | $12,794 | $991,800 | $388,300 | $603,500 |
| 2018 | $12,250 | $957,800 | $388,300 | $569,500 |
| 2017 | $12,195 | $933,800 | $388,300 | $545,500 |
| 2016 | $11,172 | $867,400 | $388,300 | $479,100 |
| 2015 | $10,741 | $845,100 | $366,000 | $479,100 |
| 2014 | $10,598 | $845,100 | $366,000 | $479,100 |
Map
- 115 Sohier St
- 215 Sohier St
- 77 Cushing Rd
- 128 Elm St Unit 211
- 20 Nichols Rd
- 147 S Main St
- 87 Elm St Unit 321
- 87 Elm St Unit 323
- 87 Elm St Unit 319
- 29 Chittenden Ln Unit 29
- 33 Cedar Acres Ln
- 124 Elm St Unit 307
- 124 Elm St Unit 308
- 131 Nichols Rd
- 131 Nichols Rd Unit 6
- 169 Pond St
- 47 Old Coach Rd
- 41 Hobart Ln
- 3 Jerusalem Ln
- 188 Forest Ave
Ask me questions while you tour the home.