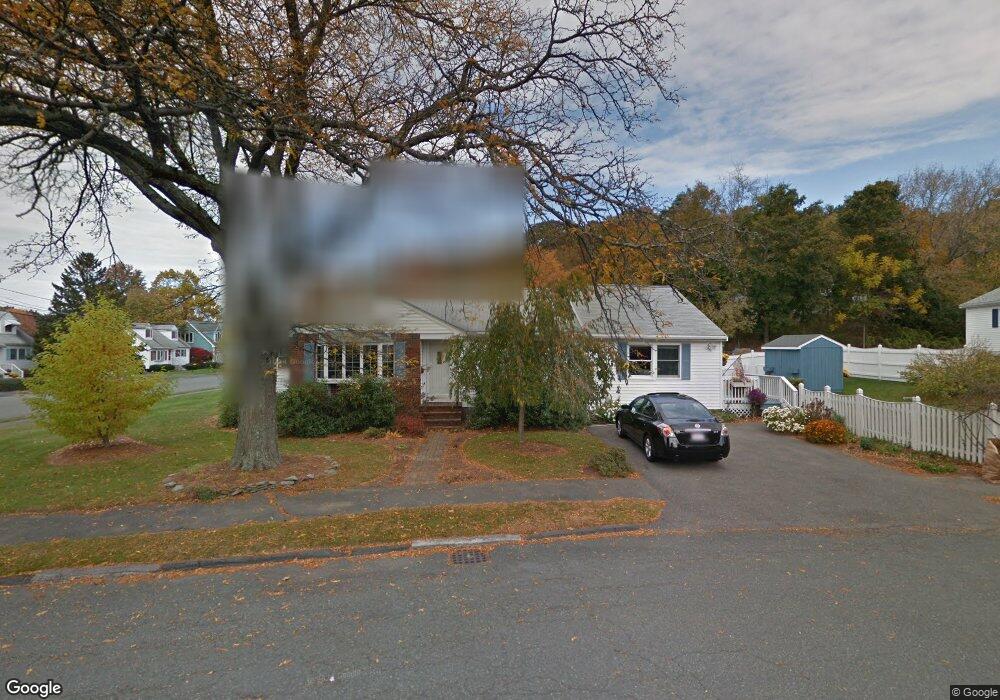
6 Robert Rd Danvers, MA 01923
Estimated Value: $642,000 - $706,000
3
Beds
2
Baths
1,526
Sq Ft
$433/Sq Ft
Est. Value
About This Home
This home is located at 6 Robert Rd, Danvers, MA 01923 and is currently estimated at $660,292, approximately $432 per square foot. 6 Robert Rd is a home located in Essex County with nearby schools including Danvers High School, St. Mary of the Annunciation School, and Plumfield Academy.
Ownership History
Date
Name
Owned For
Owner Type
Purchase Details
Closed on
May 31, 2001
Sold by
George Joan M
Bought by
George Julie A
Current Estimated Value
Purchase Details
Closed on
Oct 27, 2000
Sold by
Graves William C and Graves Mary Beth
Bought by
George Joan M
Purchase Details
Closed on
Jun 29, 1990
Sold by
Spofford Gerald V
Bought by
Graves William C
Create a Home Valuation Report for This Property
The Home Valuation Report is an in-depth analysis detailing your home's value as well as a comparison with similar homes in the area
Home Values in the Area
Average Home Value in this Area
Purchase History
| Date | Buyer | Sale Price | Title Company |
|---|---|---|---|
| George Julie A | $276,000 | -- | |
| George Joan M | $276,000 | -- | |
| Graves William C | $155,000 | -- | |
| Graves William C | $155,000 | -- |
Source: Public Records
Mortgage History
| Date | Status | Borrower | Loan Amount |
|---|---|---|---|
| Open | Graves William C | $277,500 | |
| Closed | Graves William C | $289,500 |
Source: Public Records
Tax History
| Year | Tax Paid | Tax Assessment Tax Assessment Total Assessment is a certain percentage of the fair market value that is determined by local assessors to be the total taxable value of land and additions on the property. | Land | Improvement |
|---|---|---|---|---|
| 2025 | $6,377 | $580,300 | $342,200 | $238,100 |
| 2024 | $6,414 | $577,300 | $342,200 | $235,100 |
| 2023 | $6,244 | $531,400 | $311,000 | $220,400 |
| 2022 | $6,096 | $481,500 | $282,200 | $199,300 |
| 2021 | $5,786 | $433,400 | $267,300 | $166,100 |
| 2020 | $5,620 | $430,300 | $264,200 | $166,100 |
| 2019 | $5,381 | $405,200 | $240,200 | $165,000 |
| 2018 | $5,209 | $384,700 | $237,800 | $146,900 |
| 2017 | $5,001 | $352,400 | $207,700 | $144,700 |
| 2016 | $4,760 | $335,200 | $198,100 | $137,100 |
| 2015 | $4,509 | $302,400 | $180,100 | $122,300 |
Source: Public Records
Map
Nearby Homes
- 22 Collins St Unit 46
- 18 Wadsworth St
- 35 Collins St Unit 21
- 22 Braman St
- 167 Village Post Rd Unit 167
- 43 Hobart St Unit B
- 14 Williams St Unit C17
- 22 Maple Ave
- 103 Newbury St Unit 1
- 98 Newbury St Unit 18B
- 98 Newbury St Unit 23B
- 47 Collins St Unit 50
- 57 Sylvan St Unit 1A
- 57 Sylvan St Unit 5D
- 63 Adams St
- 5 Holten St
- 35 Locust St Unit 3
- 97 Sylvan St Unit 7
- 10 Cottage Ave
- 20 Central Ave
Your Personal Tour Guide
Ask me questions while you tour the home.