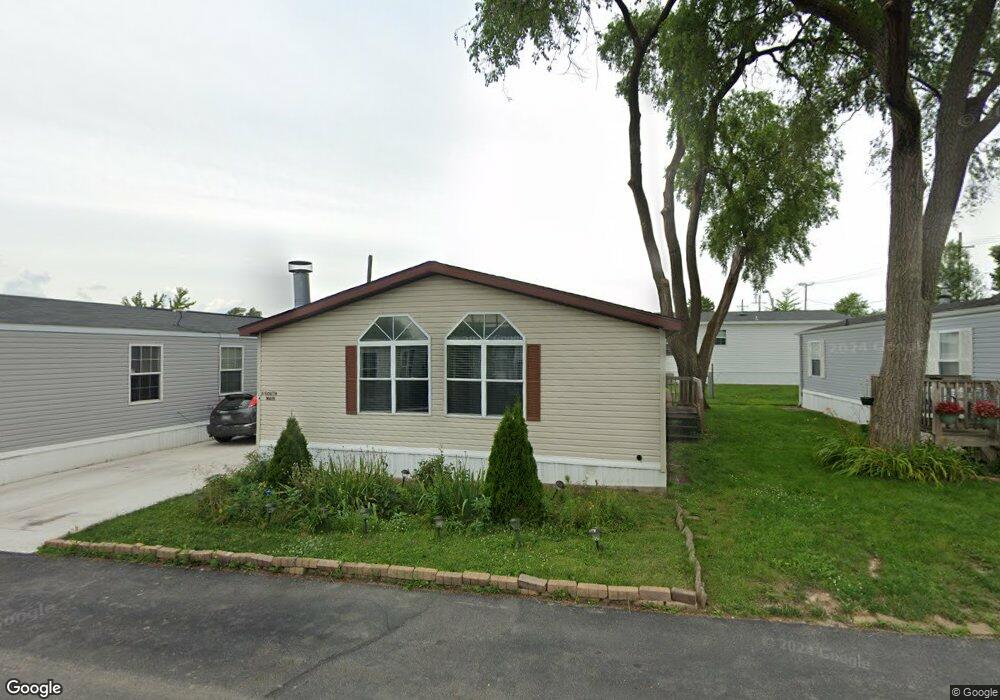
6 S Main St Northfield, IL 60093
3
Beds
2
Baths
--
Sq Ft
37,462
Sq Ft Lot
About This Home
This home is located at 6 S Main St, Northfield, IL 60093. 6 S Main St is a home located in Cook County with nearby schools including Lyon Elementary School, Pleasant Ridge Elementary School, and Attea Middle School.
Ownership History
Date
Name
Owned For
Owner Type
Purchase Details
Closed on
Sep 25, 2008
Sold by
6 N May Llc
Bought by
Unit 303 May Llc
Home Financials for this Owner
Home Financials are based on the most recent Mortgage that was taken out on this home.
Original Mortgage
$183,551
Outstanding Balance
$126,190
Interest Rate
7.5%
Mortgage Type
Commercial
Purchase Details
Closed on
Feb 26, 2008
Sold by
Plaza Bank
Bought by
Huerta 2 East Main Llc
Purchase Details
Closed on
Jul 16, 2007
Sold by
Iniguez Cecilio
Bought by
Plaza Bank
Purchase Details
Closed on
Dec 30, 2003
Sold by
Valdivia Isidro
Bought by
Martinez Miguel
Home Financials for this Owner
Home Financials are based on the most recent Mortgage that was taken out on this home.
Original Mortgage
$107,250
Interest Rate
7%
Mortgage Type
Commercial
Purchase Details
Closed on
May 22, 2003
Sold by
Rodriguez Jose A and Rodriguez Guadalupe
Bought by
Valdivia Isidro and Martinez Miguel
Purchase Details
Closed on
Nov 8, 2002
Sold by
Gonzalez Santiago and Gonzalez Maria
Bought by
Rodriguez Jose A and Rodriguez Guadalupe
Create a Home Valuation Report for This Property
The Home Valuation Report is an in-depth analysis detailing your home's value as well as a comparison with similar homes in the area
Home Values in the Area
Average Home Value in this Area
Purchase History
| Date | Buyer | Sale Price | Title Company |
|---|---|---|---|
| Unit 303 May Llc | -- | Multiple | |
| Huerta 2 East Main Llc | $130,000 | Cti | |
| Plaza Bank | -- | None Available | |
| Martinez Miguel | -- | Ftc | |
| Valdivia Isidro | $65,000 | Ticor Title Insurance | |
| Rodriguez Jose A | -- | Ticor Title Insurance |
Source: Public Records
Mortgage History
| Date | Status | Borrower | Loan Amount |
|---|---|---|---|
| Open | Unit 303 May Llc | $183,551 | |
| Previous Owner | Martinez Miguel | $107,250 |
Source: Public Records
Tax History
| Year | Tax Paid | Tax Assessment Tax Assessment Total Assessment is a certain percentage of the fair market value that is determined by local assessors to be the total taxable value of land and additions on the property. | Land | Improvement |
|---|---|---|---|---|
| 2025 | $2,703 | $5,087 | $2,813 | $2,274 |
| 2024 | $2,703 | $5,087 | $2,813 | $2,274 |
| 2023 | $4,992 | $5,087 | $2,813 | $2,274 |
| 2022 | $4,992 | $7,899 | $5,625 | $2,274 |
| 2021 | $4,794 | $7,898 | $5,625 | $2,273 |
| 2020 | $4,641 | $7,898 | $5,625 | $2,273 |
| 2019 | $3,469 | $6,023 | $3,750 | $2,273 |
| 2018 | $3,298 | $6,023 | $3,750 | $2,273 |
| 2017 | $3,152 | $6,023 | $3,750 | $2,273 |
| 2016 | $2,978 | $5,554 | $3,281 | $2,273 |
| 2015 | $2,944 | $5,554 | $3,281 | $2,273 |
| 2014 | $2,918 | $5,554 | $3,281 | $2,273 |
| 2013 | $2,810 | $5,554 | $3,281 | $2,273 |
Source: Public Records
Map
Nearby Homes
- 431 4th St
- 1716 Wildberry Dr Unit J
- 1720 Wildberry Dr Unit B
- 1821 Wildberry Dr Unit A
- 1571 Winnetka Rd Unit 1571
- 1827 Waterbury Cir
- 1410 Tuscany Ct
- 220 Sunset Ridge Rd
- 2700 Summit Dr Unit 101
- 2335 Pebblefork Ln
- 1774 Rogers Ave
- 1955 Tanglewood Dr Unit H
- 1855 Tanglewood Dr Unit F
- 1809 Jefferson Ave
- 1427 Kenilworth Ln
- 2000 Chestnut Ave Unit 103
- 2000 Chestnut Ave Unit 407
- 947 Kensington Dr Unit 7E3
- 2325 Sundrop Dr
- 2220 Founders Dr Unit 213
- 19 S Main St
- 2 Main St
- 18 S Main St
- 8 S Main St
- 1 Main St
- 16 S Main St
- 339 3rd St
- 1 S Branch Rd Unit 1
- 57 E South Branch Rd
- 315 3rd St
- 432 4th St
- 414 4th St
- 311 3rd St
- 311 3rd St Unit 311
- 211 Waukegan Rd Unit 101
- 1708 Wildberry Dr Unit 19D
- 1708 Wildberry Dr Unit 19E
- 1708 Wildberry Dr Unit 19A
- 1708 Wildberry Dr Unit 19B
- 1708 Wildberry Dr Unit 21E
Your Personal Tour Guide
Ask me questions while you tour the home.