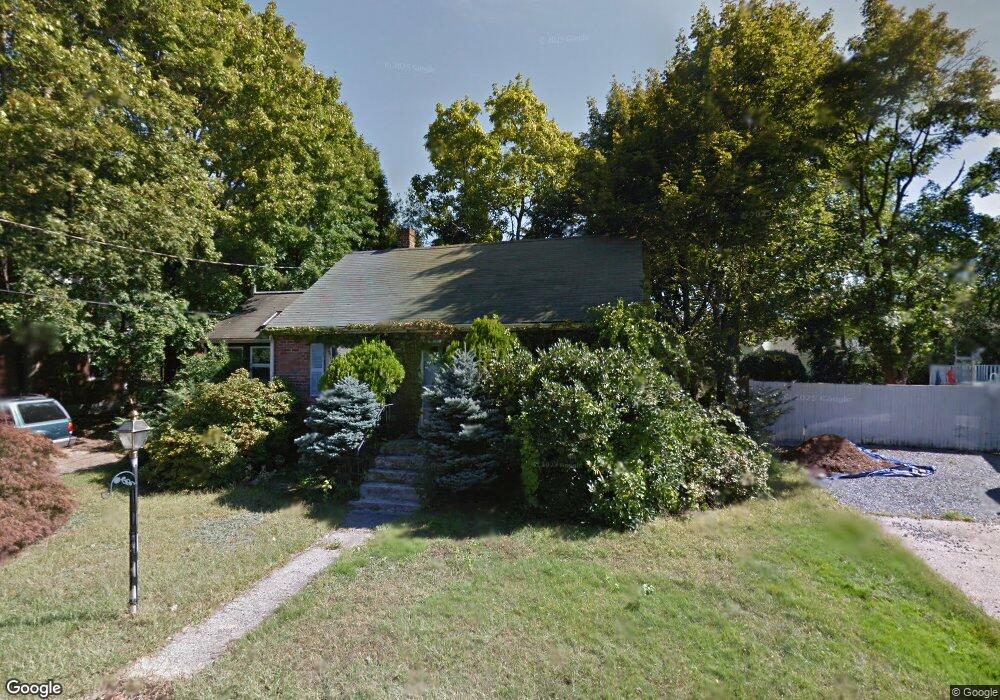
6 Veterans Ln Stoneham, MA 02180
Colonial Park NeighborhoodEstimated Value: $629,000 - $670,000
3
Beds
1
Bath
1,225
Sq Ft
$530/Sq Ft
Est. Value
About This Home
This home is located at 6 Veterans Ln, Stoneham, MA 02180 and is currently estimated at $649,703, approximately $530 per square foot. 6 Veterans Ln is a home located in Middlesex County with nearby schools including Stoneham High School, St. Patrick Elementary School, and Greater Boston Academy.
Ownership History
Date
Name
Owned For
Owner Type
Purchase Details
Closed on
Sep 30, 2025
Sold by
Fowlie Roy
Bought by
Christopher A Abreu Ret and Abreu
Current Estimated Value
Purchase Details
Closed on
Dec 23, 2014
Sold by
Fowlie Roy and Fowlie Katherine
Bought by
Fowlie Roy
Home Financials for this Owner
Home Financials are based on the most recent Mortgage that was taken out on this home.
Original Mortgage
$121,000
Interest Rate
4.02%
Mortgage Type
New Conventional
Purchase Details
Closed on
Sep 12, 2014
Sold by
Dehart Linda
Bought by
Fowlie Katherine and Fowlie Roy
Create a Home Valuation Report for This Property
The Home Valuation Report is an in-depth analysis detailing your home's value as well as a comparison with similar homes in the area
Home Values in the Area
Average Home Value in this Area
Purchase History
We collect this data history from publicly available records. To have your information removed, we recommend requesting removal directly through your county’s website.
| Date | Buyer | Sale Price | Title Company |
|---|---|---|---|
| Christopher A Abreu Ret | $630,000 | -- | |
| Fowlie Roy | $121,000 | -- | |
| Fowlie Roy | $121,000 | -- | |
| Fowlie Katherine | $100,000 | -- | |
| Fowlie Katherine | $100,000 | -- |
Source: Public Records
Mortgage History
We collect this data history from publicly available records. To have your information removed, we recommend requesting removal directly through your county’s website.
| Date | Status | Borrower | Loan Amount |
|---|---|---|---|
| Previous Owner | Fowlie Roy | $121,000 |
Source: Public Records
Tax History
| Year | Tax Paid | Tax Assessment Tax Assessment Total Assessment is a certain percentage of the fair market value that is determined by local assessors to be the total taxable value of land and additions on the property. | Land | Improvement |
|---|---|---|---|---|
| 2025 | $6,023 | $588,800 | $373,500 | $215,300 |
| 2024 | $5,812 | $548,800 | $345,500 | $203,300 |
| 2023 | $5,683 | $512,000 | $317,500 | $194,500 |
| 2022 | $4,926 | $473,200 | $289,500 | $183,700 |
| 2021 | $4,825 | $445,900 | $270,800 | $175,100 |
| 2020 | $4,707 | $436,200 | $257,700 | $178,500 |
| 2019 | $4,777 | $425,800 | $246,200 | $179,600 |
| 2018 | $4,513 | $385,400 | $220,900 | $164,500 |
| 2017 | $4,372 | $352,900 | $205,600 | $147,300 |
| 2016 | $4,366 | $343,800 | $205,600 | $138,200 |
| 2015 | $4,003 | $308,900 | $205,600 | $103,300 |
| 2014 | $3,830 | $283,900 | $187,700 | $96,200 |
Source: Public Records
Map
Nearby Homes
- 5 Veterans Ln
- 9 Veterans Ln
- Lot 6 Veterans Way Unit 2
- 10 Fatima Rd
- 4 Veterans Way
- Lot 4 Veterans Way
- 1 Veterans Ln
- 4 Veterans Ln
- Lot 1 Veterans Way
- 8 Fatima Rd
- 12 Fatima Rd
- 8 Veterans Ln
- 2 Veterans Ln
- 2 Veterans Way
- 6 Cardinal Rd
- 90 Spring St
- 88 Spring St
- 88 Spring St Unit 1
- 11 Fatima Rd
- 9 Fatima Rd
Your Personal Tour Guide
Ask me questions while you tour the home.