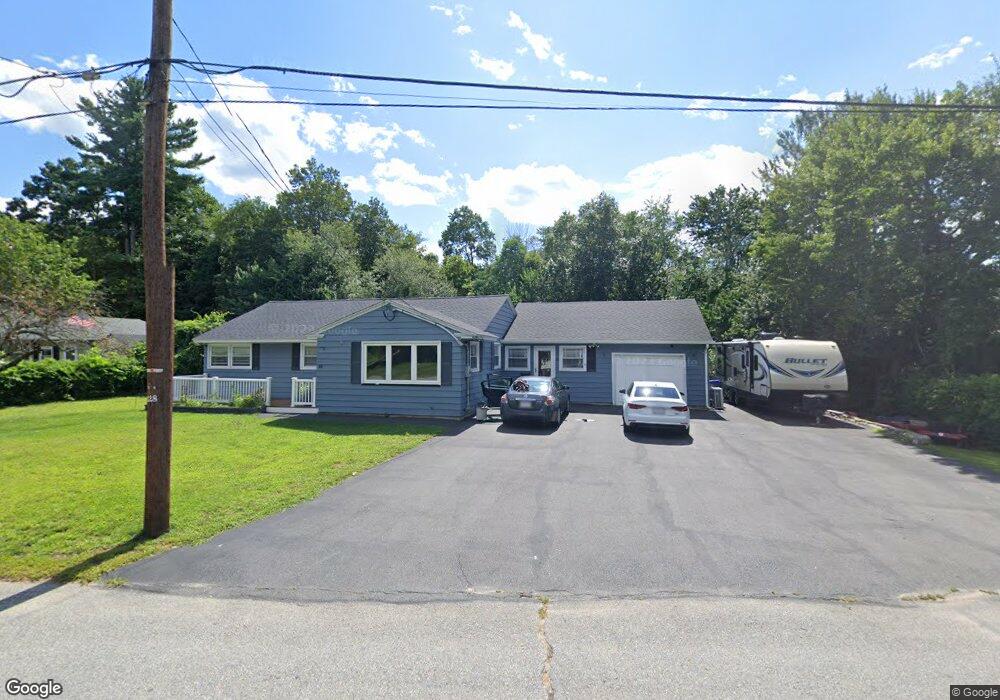
60 Hazel St Methuen, MA 01844
Downtown Methuen NeighborhoodEstimated Value: $547,987 - $587,000
3
Beds
1
Bath
1,902
Sq Ft
$301/Sq Ft
Est. Value
About This Home
This home is located at 60 Hazel St, Methuen, MA 01844 and is currently estimated at $572,997, approximately $301 per square foot. 60 Hazel St is a home located in Essex County with nearby schools including Tenney Grammar School, Methuen High School, and Lawrence Family Development Charter School.
Ownership History
Date
Name
Owned For
Owner Type
Purchase Details
Closed on
Sep 1, 1998
Sold by
Mackey Peter
Bought by
Kushmerek Frank A
Current Estimated Value
Home Financials for this Owner
Home Financials are based on the most recent Mortgage that was taken out on this home.
Original Mortgage
$118,750
Interest Rate
6.9%
Mortgage Type
Purchase Money Mortgage
Create a Home Valuation Report for This Property
The Home Valuation Report is an in-depth analysis detailing your home's value as well as a comparison with similar homes in the area
Home Values in the Area
Average Home Value in this Area
Purchase History
| Date | Buyer | Sale Price | Title Company |
|---|---|---|---|
| Kushmerek Frank A | $125,000 | -- | |
| Kushmerek Frank A | $125,000 | -- |
Source: Public Records
Mortgage History
| Date | Status | Borrower | Loan Amount |
|---|---|---|---|
| Open | Kushmerek Frank A | $155,000 | |
| Closed | Kushmerek Frank A | $160,000 | |
| Closed | Kushmerek Frank A | $137,400 | |
| Closed | Kushmerek Frank A | $118,750 |
Source: Public Records
Tax History
| Year | Tax Paid | Tax Assessment Tax Assessment Total Assessment is a certain percentage of the fair market value that is determined by local assessors to be the total taxable value of land and additions on the property. | Land | Improvement |
|---|---|---|---|---|
| 2025 | $4,897 | $462,900 | $223,800 | $239,100 |
| 2024 | $4,814 | $443,300 | $204,100 | $239,200 |
| 2023 | $4,567 | $390,300 | $181,500 | $208,800 |
| 2022 | $4,368 | $334,700 | $151,200 | $183,500 |
| 2021 | $4,098 | $310,700 | $143,700 | $167,000 |
| 2020 | $4,091 | $304,400 | $143,700 | $160,700 |
| 2019 | $3,816 | $268,900 | $128,500 | $140,400 |
| 2018 | $3,732 | $261,500 | $128,500 | $133,000 |
| 2017 | $3,627 | $247,600 | $128,500 | $119,100 |
| 2016 | $3,463 | $233,800 | $121,000 | $112,800 |
| 2015 | $3,358 | $230,000 | $121,000 | $109,000 |
Source: Public Records
Map
Nearby Homes
- 26 Hobson St
- 13 Caswell Ave
- 29 Heather Dr Unit 34
- 35 Ponderosa Ave
- 57 Ashland Ave
- 20-22 Highgate St
- 12-14 Highgate St
- 16 Highgate St
- 7 Field Ave
- 15 Crescent St Unit D
- 11 Oakland Ave
- 0 Hudson Ave
- 40-42 Holly St
- 16 Marjorie St
- 100 Hancock St
- 202 Broadway Unit 2-3
- 202 Broadway Unit 3-2
- 13 Walnut St
- 312 Water St Unit 33
- 281 Broadway
Your Personal Tour Guide
Ask me questions while you tour the home.