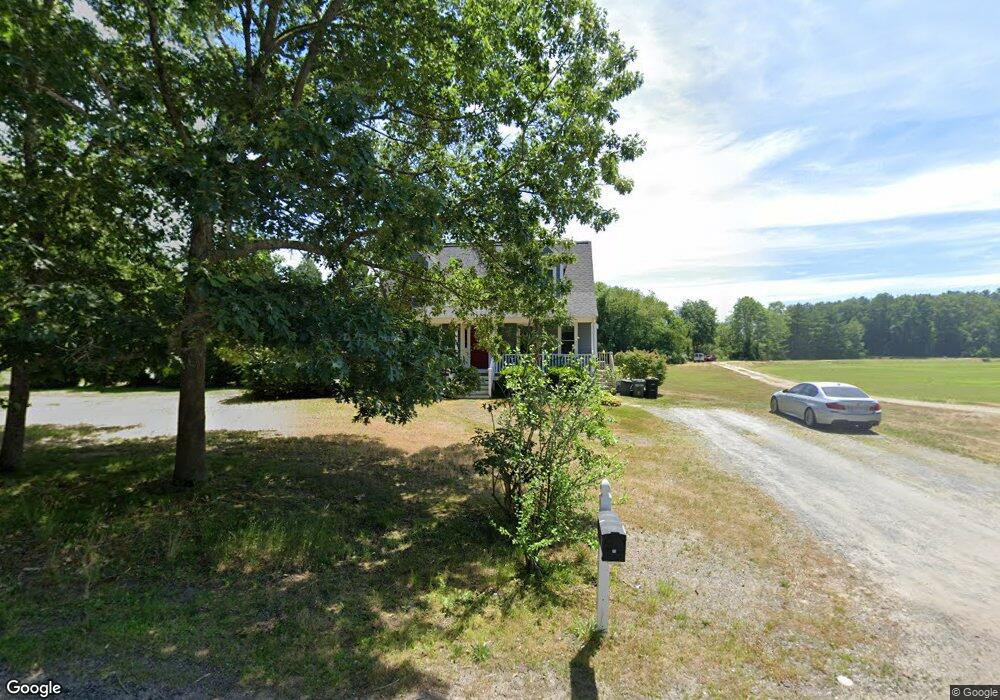
60 Lingan St Halifax, MA 02338
Estimated Value: $509,000 - $582,000
3
Beds
2
Baths
1,428
Sq Ft
$381/Sq Ft
Est. Value
About This Home
This home is located at 60 Lingan St, Halifax, MA 02338 and is currently estimated at $543,939, approximately $380 per square foot. 60 Lingan St is a home located in Plymouth County with nearby schools including Silver Lake Regional High School, Halifax Elementary School, and Silver Lake Regional Middle School.
Ownership History
Date
Name
Owned For
Owner Type
Purchase Details
Closed on
Jan 26, 2021
Sold by
Sanderson Mary B
Bought by
Barnes Derek T and Barnes Jennifer M
Current Estimated Value
Purchase Details
Closed on
Jun 23, 2000
Sold by
Goscon Inc
Bought by
Sanderson Mary Berry
Create a Home Valuation Report for This Property
The Home Valuation Report is an in-depth analysis detailing your home's value as well as a comparison with similar homes in the area
Home Values in the Area
Average Home Value in this Area
Purchase History
| Date | Buyer | Sale Price | Title Company |
|---|---|---|---|
| Barnes Derek T | -- | None Available | |
| Sanderson Mary Berry | $209,000 | -- |
Source: Public Records
Mortgage History
| Date | Status | Borrower | Loan Amount |
|---|---|---|---|
| Previous Owner | Sanderson Mary Berry | $270,000 | |
| Previous Owner | Sanderson Mary Berry | $250,000 | |
| Previous Owner | Sanderson Mary Berry | $236,000 | |
| Previous Owner | Sanderson Mary Berry | $202,000 |
Source: Public Records
Tax History
| Year | Tax Paid | Tax Assessment Tax Assessment Total Assessment is a certain percentage of the fair market value that is determined by local assessors to be the total taxable value of land and additions on the property. | Land | Improvement |
|---|---|---|---|---|
| 2025 | $7,078 | $496,000 | $164,300 | $331,700 |
| 2024 | $6,925 | $480,900 | $158,000 | $322,900 |
| 2023 | $6,825 | $458,700 | $153,400 | $305,300 |
| 2022 | $6,860 | $428,500 | $152,200 | $276,300 |
| 2021 | $6,537 | $375,900 | $146,300 | $229,600 |
| 2020 | $6,176 | $354,100 | $146,300 | $207,800 |
| 2019 | $6,046 | $346,100 | $142,000 | $204,100 |
| 2018 | $5,689 | $322,300 | $127,400 | $194,900 |
| 2017 | $5,440 | $293,600 | $114,000 | $179,600 |
| 2016 | $5,442 | $282,700 | $112,800 | $169,900 |
| 2015 | $5,403 | $284,500 | $112,800 | $171,700 |
Source: Public Records
Map
Nearby Homes
- 8 10th Ave
- 343 Monponsett St
- 265 Monponsett St Unit 2210
- 265 Monponsett St Unit 2203
- 266 Monponsett St Unit 1103
- 266 Monponsett St Unit 1105
- 266 Monponsett St Unit 1201
- 266 Monponsett St Unit 1308
- 266 Monponsett St Unit 1108
- 266 Monponsett St Unit 1101
- 266 Monponsett St Unit 1301
- 266 Monponsett St Unit 302
- 266 Monponsett St Unit 1209
- 2 Country Club Dr
- 553 Monponsett St
- 37 Annawon Dr
- 53 Stoney Weir Rd
- 15 Ocean Ave
- 8 Beechwood Rd
- 21 Parkwood Dr
Your Personal Tour Guide
Ask me questions while you tour the home.