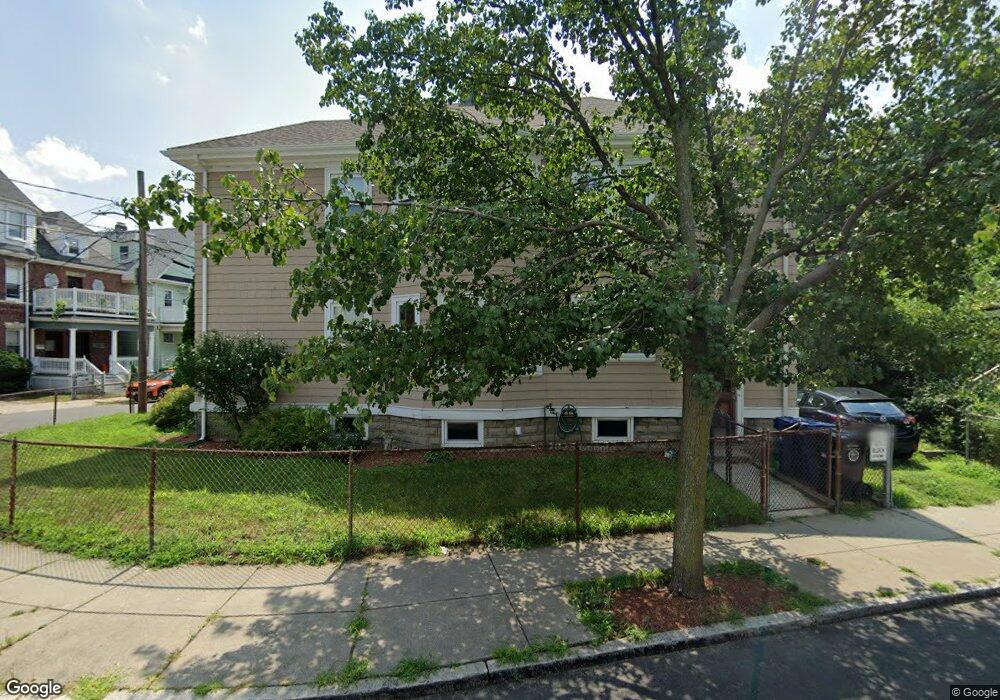
60 Royal St Allston, MA 02134
Allston NeighborhoodEstimated Value: $1,219,000 - $1,574,987
4
Beds
2
Baths
2,436
Sq Ft
$574/Sq Ft
Est. Value
About This Home
This home is located at 60 Royal St, Allston, MA 02134 and is currently estimated at $1,397,747, approximately $573 per square foot. 60 Royal St is a home located in Suffolk County with nearby schools including Match Charter Public School, German International School Boston, and St Herman Of Alaska Christian School.
Ownership History
Date
Name
Owned For
Owner Type
Purchase Details
Closed on
Jul 6, 1987
Sold by
Hood James R
Bought by
Zieff William
Current Estimated Value
Home Financials for this Owner
Home Financials are based on the most recent Mortgage that was taken out on this home.
Original Mortgage
$142,000
Interest Rate
10.76%
Mortgage Type
Purchase Money Mortgage
Create a Home Valuation Report for This Property
The Home Valuation Report is an in-depth analysis detailing your home's value as well as a comparison with similar homes in the area
Home Values in the Area
Average Home Value in this Area
Purchase History
| Date | Buyer | Sale Price | Title Company |
|---|---|---|---|
| Zieff William | $177,500 | -- |
Source: Public Records
Mortgage History
| Date | Status | Borrower | Loan Amount |
|---|---|---|---|
| Open | Zieff William | $250,000 | |
| Closed | Zieff William | $176,000 | |
| Closed | Zieff William | $142,000 |
Source: Public Records
Tax History
| Year | Tax Paid | Tax Assessment Tax Assessment Total Assessment is a certain percentage of the fair market value that is determined by local assessors to be the total taxable value of land and additions on the property. | Land | Improvement |
|---|---|---|---|---|
| 2025 | $14,810 | $1,278,900 | $468,700 | $810,200 |
| 2024 | $12,949 | $1,188,000 | $292,900 | $895,100 |
| 2023 | $12,032 | $1,120,300 | $276,200 | $844,100 |
| 2022 | $11,499 | $1,056,900 | $260,600 | $796,300 |
| 2021 | $11,277 | $1,056,900 | $260,600 | $796,300 |
| 2020 | $8,969 | $849,300 | $237,700 | $611,600 |
| 2019 | $8,431 | $799,900 | $175,300 | $624,600 |
| 2018 | $7,761 | $740,600 | $175,300 | $565,300 |
| 2017 | $7,689 | $726,100 | $175,300 | $550,800 |
| 2016 | $6,945 | $631,400 | $175,300 | $456,100 |
| 2015 | $6,771 | $559,100 | $154,000 | $405,100 |
| 2014 | $6,114 | $486,000 | $154,000 | $332,000 |
Source: Public Records
Map
Nearby Homes
- 63 Coolidge Rd
- 5 Alcott St
- 35-37 Haskell St
- 172-174 Franklin St
- 35 Adamson St
- 4 Franklin St Unit 202
- 4 Franklin St Unit 401
- 15 Raymond St Unit 1
- 231 Everett St Unit 1
- 195 Cambridge St Unit 3
- 189 Cambridge St Unit 3
- 20 Penniman Rd Unit P3
- 30 Penniman Rd Unit 702
- 30 Penniman Rd Unit 201
- 30 Penniman Rd Unit 206
- 30 Penniman Rd Unit 302
- 54 Antwerp St
- 59 Brighton Ave Unit 1
- 59 Brighton Ave Unit A
- 57 Brighton Ave Unit C
- 60 Royal St
- 60 Royal St Unit 1
- 58 Royal St
- 54 Royal St
- 41 Mansfield St
- 41 Mansfield St Unit 1
- 63 Coolidge Rd Unit 1
- 63 Coolidge Rd Unit 2
- 61 Royal St
- 61 Royal St
- 61 Royal St Unit 2
- 61 Royal St Unit 1
- 61 Royal St Unit 3
- 69 Coolidge Rd Unit 2
- 69 Coolidge Rd Unit 3
- 69 Coolidge Rd Unit 1
- 69 Coolidge Rd
- 69 Coolidge Rd
- 69 Coolidge Rd Unit 2
- 57 Royal St Unit 59
Your Personal Tour Guide
Ask me questions while you tour the home.