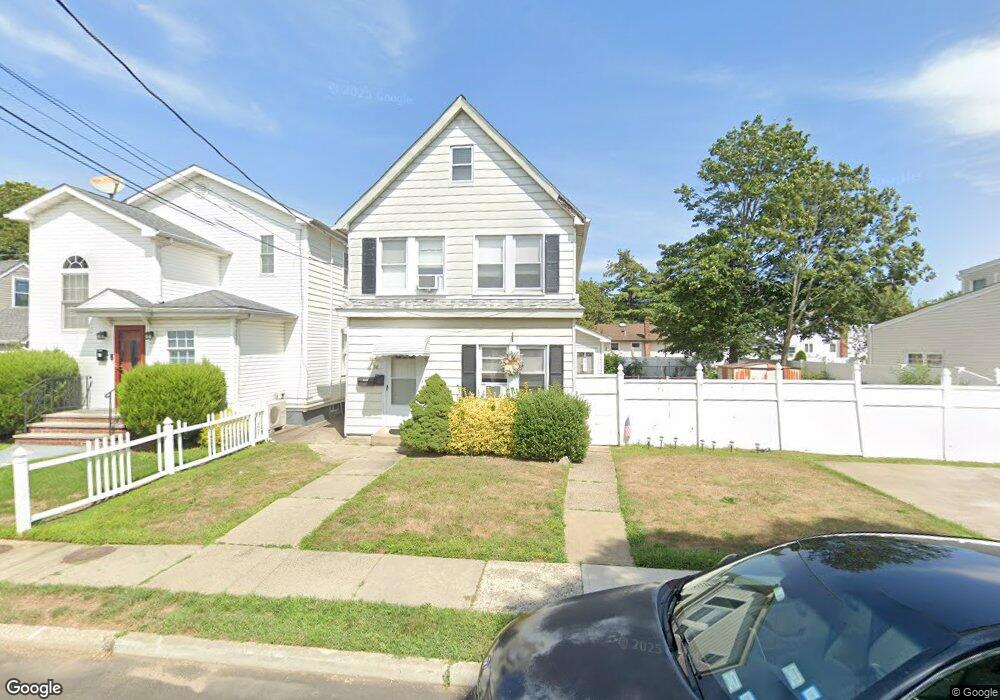
60 S 4th St Bethpage, NY 11714
Estimated Value: $781,195 - $790,000
Studio
3
Baths
1,676
Sq Ft
$469/Sq Ft
Est. Value
About This Home
This home is located at 60 S 4th St, Bethpage, NY 11714 and is currently estimated at $785,598, approximately $468 per square foot. 60 S 4th St is a home located in Nassau County with nearby schools including Central Boulevard Elementary School, John F Kennedy Middle School, and Bethpage Senior High School.
Ownership History
Date
Name
Owned For
Owner Type
Purchase Details
Closed on
Jun 18, 2004
Sold by
Seminario Charles
Bought by
Martins Jose
Current Estimated Value
Purchase Details
Closed on
Jul 27, 1995
Sold by
Agiesta Thomas and Agiesta Francis
Bought by
Seminario Nicholas and Seminario Charles
Home Financials for this Owner
Home Financials are based on the most recent Mortgage that was taken out on this home.
Original Mortgage
$111,750
Interest Rate
7.48%
Create a Home Valuation Report for This Property
The Home Valuation Report is an in-depth analysis detailing your home's value as well as a comparison with similar homes in the area
Home Values in the Area
Average Home Value in this Area
Purchase History
| Date | Buyer | Sale Price | Title Company |
|---|---|---|---|
| Martins Jose | $361,500 | -- | |
| -- | -- | -- | |
| Seminario Nicholas | $149,000 | -- |
Source: Public Records
Mortgage History
| Date | Status | Borrower | Loan Amount |
|---|---|---|---|
| Previous Owner | Seminario Nicholas | $111,750 |
Source: Public Records
Tax History
| Year | Tax Paid | Tax Assessment Tax Assessment Total Assessment is a certain percentage of the fair market value that is determined by local assessors to be the total taxable value of land and additions on the property. | Land | Improvement |
|---|---|---|---|---|
| 2025 | $12,897 | $462 | $231 | $231 |
| 2024 | $4,335 | $468 | $234 | $234 |
Source: Public Records
Map
Nearby Homes
Your Personal Tour Guide
Ask me questions while you tour the home.