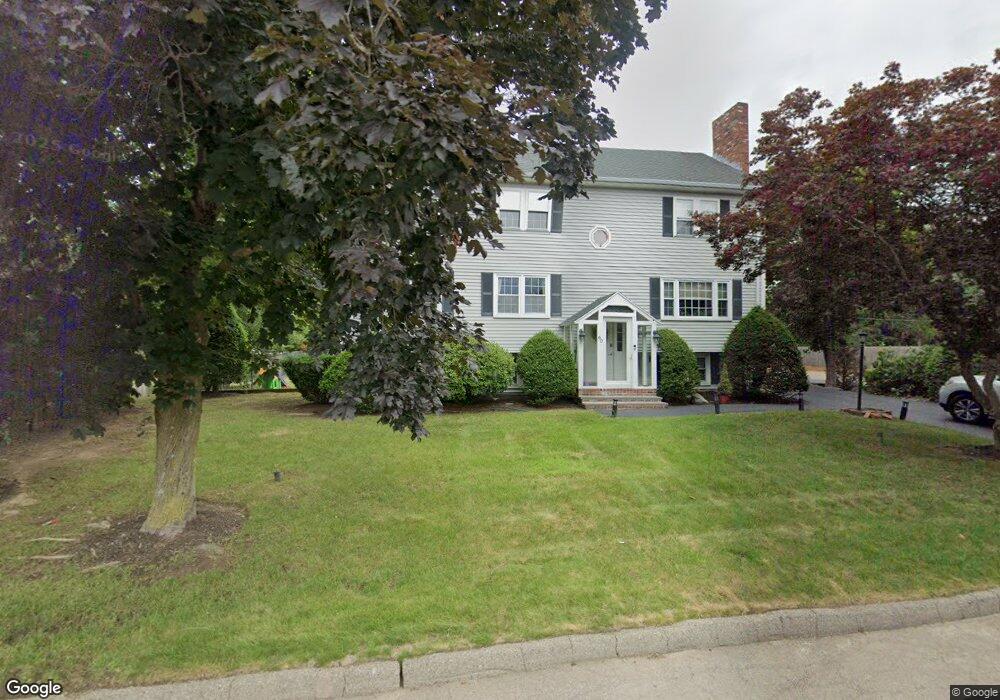
60 Smith Ave Stoughton, MA 02072
Estimated Value: $708,000 - $934,000
About This Home
This home is located at 60 Smith Ave, Stoughton, MA 02072 and is currently estimated at $809,221, approximately $283 per square foot. 60 Smith Ave is a home located in Norfolk County with nearby schools including Helen Hansen Elementary School, O'Donnell Middle School, and Stoughton High School.
Ownership History
We collect this data history from publicly available records. To have your information removed, we recommend requesting removal directly through your county’s website.
Purchase Details
Purchase Details
Home Values in the Area
Average Home Value in this Area
Purchase History
We collect this data history from publicly available records. To have your information removed, we recommend requesting removal directly through your county’s website.
| Date | Buyer | Sale Price | Title Company |
|---|---|---|---|
| -- | -- | ||
| -- | -- | ||
| -- | -- | ||
| $71,500 | -- |
Mortgage History
We collect this data history from publicly available records. To have your information removed, we recommend requesting removal directly through your county’s website.
| Date | Status | Borrower | Loan Amount |
|---|---|---|---|
| Previous Owner | $120,000 | ||
| Previous Owner | $100,000 | ||
| Previous Owner | $80,000 | ||
| Previous Owner | $35,000 |
Tax History
We collect this data history from publicly available records. To have your information removed, we recommend requesting removal directly through your county’s website.
| Year | Tax Paid | Tax Assessment Tax Assessment Total Assessment is a certain percentage of the fair market value that is determined by local assessors to be the total taxable value of land and additions on the property. | Land | Improvement |
|---|---|---|---|---|
| 2025 | $7,106 | $574,000 | $222,300 | $351,700 |
| 2024 | $6,896 | $541,700 | $203,000 | $338,700 |
| 2023 | $6,774 | $499,900 | $185,500 | $314,400 |
| 2022 | $6,611 | $458,800 | $178,500 | $280,300 |
| 2021 | $6,212 | $411,400 | $157,500 | $253,900 |
| 2020 | $6,042 | $405,800 | $157,500 | $248,300 |
| 2019 | $5,906 | $385,000 | $157,500 | $227,500 |
| 2018 | $5,345 | $360,900 | $154,000 | $206,900 |
| 2017 | $5,150 | $355,400 | $152,300 | $203,100 |
| 2016 | $5,007 | $334,500 | $143,500 | $191,000 |
| 2015 | $4,929 | $325,800 | $134,800 | $191,000 |
| 2014 | $4,793 | $304,500 | $122,500 | $182,000 |
Map
- 19 Country Ln
- 2 Hillwood Ave
- 24 Spallus Rd
- 35 Spallus Rd
- 1716 Central St
- 22 Kwedar Ave
- 15 Larason Farm Rd
- 84 Kim Terrace
- 2161 Central St
- 43 Gilbert Dr
- 438 School St
- 138 Kotlik St
- 47 Claire Dr
- 53 Frances Dr
- 18 Copperwood Dr Unit 18
- 39 Christopher Dr Unit G
- 292 Island St
- 161 Winslow Dr
- 140 Grace Ln
- 7 Dry Pond Rd
Ask me questions while you tour the home.