60 Squire Rd Winchester, MA 01890
West Side NeighborhoodEstimated Value: $1,269,000 - $1,482,000
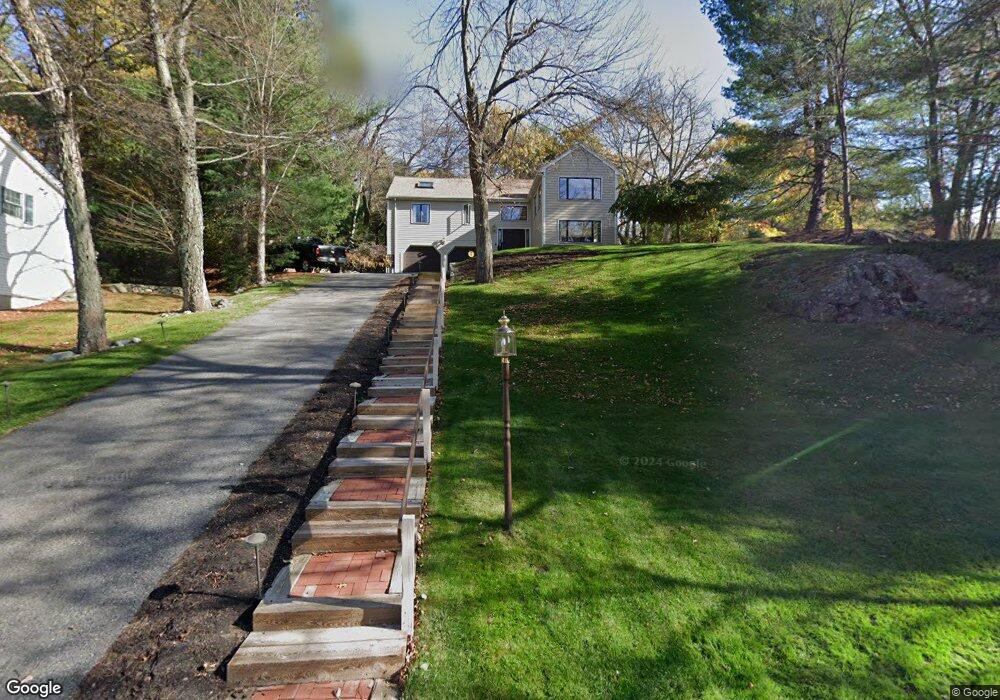
About This Home
This home is located at 60 Squire Rd, Winchester, MA 01890 and is currently estimated at $1,365,877, approximately $588 per square foot. 60 Squire Rd is a home located in Middlesex County with nearby schools including Vinson-Owen Elementary School, McCall Middle School, and Winchester High School.
Ownership History
We collect this data history from publicly available records. To have your information removed, we recommend requesting removal directly through your county’s website.
Purchase Details
Home Values in the Area
Average Home Value in this Area
Purchase History
We collect this data history from publicly available records. To have your information removed, we recommend requesting removal directly through your county’s website.
| Date | Buyer | Sale Price | Title Company |
|---|---|---|---|
| $134,500 | -- |
Mortgage History
We collect this data history from publicly available records. To have your information removed, we recommend requesting removal directly through your county’s website.
| Date | Status | Borrower | Loan Amount |
|---|---|---|---|
| Open | $129,500 | ||
| Closed | $80,000 | ||
| Closed | $220,000 |
Tax History
We collect this data history from publicly available records. To have your information removed, we recommend requesting removal directly through your county’s website.
| Year | Tax Paid | Tax Assessment Tax Assessment Total Assessment is a certain percentage of the fair market value that is determined by local assessors to be the total taxable value of land and additions on the property. | Land | Improvement |
|---|---|---|---|---|
| 2025 | $136 | $1,222,100 | $801,000 | $421,100 |
| 2024 | $13,391 | $1,181,900 | $761,000 | $420,900 |
| 2023 | $12,082 | $1,023,900 | $661,000 | $362,900 |
| 2022 | $12,097 | $967,000 | $600,900 | $366,100 |
| 2021 | $11,380 | $887,000 | $520,900 | $366,100 |
| 2020 | $10,866 | $877,000 | $510,900 | $366,100 |
| 2019 | $10,015 | $827,000 | $460,900 | $366,100 |
| 2018 | $9,752 | $800,000 | $438,900 | $361,100 |
| 2017 | $9,576 | $779,800 | $438,900 | $340,900 |
| 2016 | $9,015 | $771,800 | $430,900 | $340,900 |
| 2015 | $8,725 | $718,700 | $400,900 | $317,800 |
| 2014 | $8,819 | $696,600 | $390,900 | $305,700 |
Map
- 105 Thornberry Rd
- 94 Johnson Rd
- 15 Thornberry Rd
- 12 Cox Rd
- 11 Carriage Ln
- 14 Nassau Dr
- 8 Hawthorne Rd
- 276 High St
- 15 Fieldstone Dr
- 13 Paddock Ln Unit 13
- 28 Tyler Rd
- 1 Plymouth Rd
- 37 Mayflower Rd
- 38 Waltham St
- 63 Dunster Ln
- 16 Winchester Dr
- 343 Lexington St
- 7 Ridge St
- 7 Wainwright Rd Unit 47
- 268 Lexington St
Ask me questions while you tour the home.