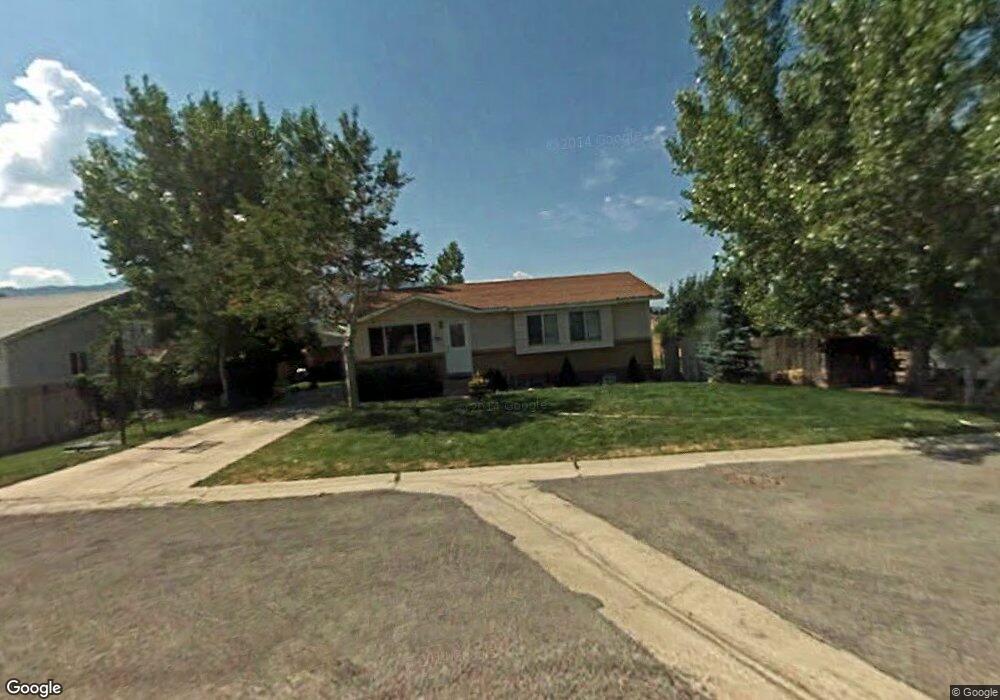
600 E 340 S Fillmore, UT 84631
Fillmore AreaEstimated Value: $300,000 - $333,722
About This Home
This home is located at 600 E 340 S, Fillmore, UT 84631 and is currently estimated at $318,181, approximately $174 per square foot. 600 E 340 S is a home located in Millard County.
Ownership History
We collect this data history from publicly available records. To have your information removed, we recommend requesting removal directly through your county’s website.
Purchase Details
Home Financials for this Owner
Home Financials are based on the most recent Mortgage that was taken out on this home.Home Values in the Area
Average Home Value in this Area
Purchase History
We collect this data history from publicly available records. To have your information removed, we recommend requesting removal directly through your county’s website.
| Date | Buyer | Sale Price | Title Company |
|---|---|---|---|
| -- | -- |
Mortgage History
We collect this data history from publicly available records. To have your information removed, we recommend requesting removal directly through your county’s website.
| Date | Status | Borrower | Loan Amount |
|---|---|---|---|
| Open | $135,800 | ||
| Closed | $147,900 | ||
| Previous Owner | $86,400 | ||
| Previous Owner | $10,800 |
Tax History
We collect this data history from publicly available records. To have your information removed, we recommend requesting removal directly through your county’s website.
| Year | Tax Paid | Tax Assessment Tax Assessment Total Assessment is a certain percentage of the fair market value that is determined by local assessors to be the total taxable value of land and additions on the property. | Land | Improvement |
|---|---|---|---|---|
| 2025 | $1,259 | $158,152 | $26,267 | $131,885 |
| 2024 | $1,259 | $137,388 | $17,070 | $120,318 |
| 2023 | $1,494 | $137,388 | $17,070 | $120,318 |
| 2022 | $1,127 | $101,221 | $15,518 | $85,703 |
| 2021 | $994 | $85,687 | $12,932 | $72,755 |
| 2020 | $839 | $72,781 | $11,756 | $61,025 |
| 2019 | $720 | $62,590 | $11,756 | $50,834 |
| 2018 | $685 | $60,990 | $11,756 | $49,234 |
| 2017 | $682 | $57,683 | $11,550 | $46,133 |
| 2016 | $652 | $57,683 | $11,550 | $46,133 |
| 2015 | $652 | $57,683 | $11,550 | $46,133 |
| 2014 | -- | $57,683 | $11,550 | $46,133 |
| 2013 | -- | $57,683 | $11,550 | $46,133 |
Map
- 430 E Canyon Rd
- 750 800 South Fillmore
- 825 800 South Fillmore
- 800 800 South Fillmore
- 405 E 500 St S
- 250 E 500 South St
- 775 E Valley View Rd
- 760 E 700 St S
- 65 S 100 E
- 40 S 100 Rd E
- 465 S 100 W
- 415 S 200 W
- 50 N 100 W
- 35 N 100 W
- 155 W Center St
- 75 N 100 West St
- 90 S 200 W
- 260 W 200 S
- 351 W 100 South St
- 365 N Main St
Ask me questions while you tour the home.