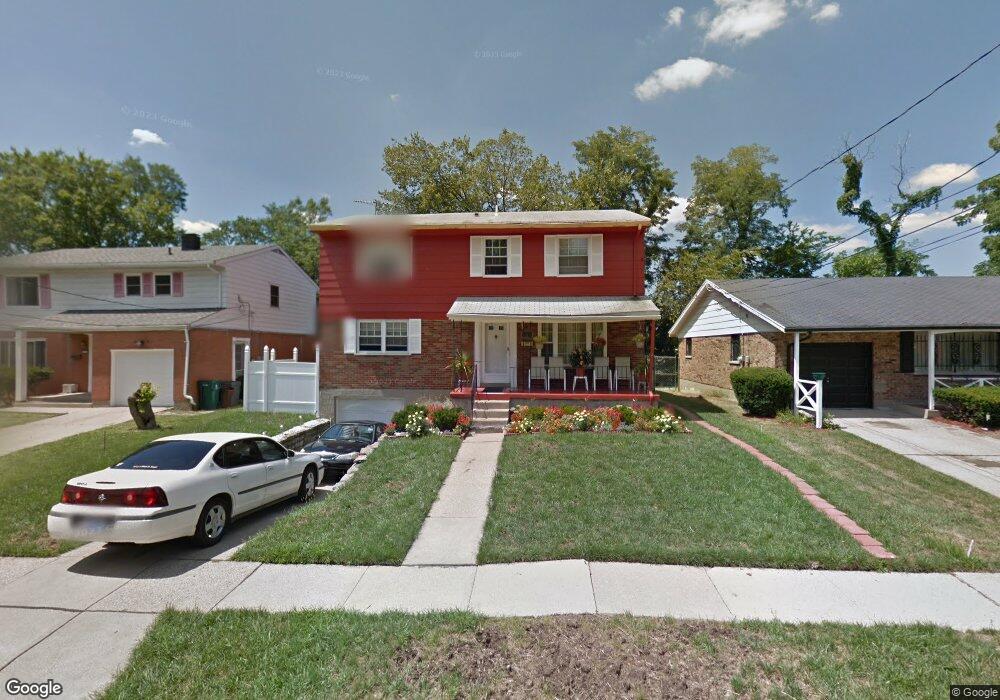
6009 Waldway Ln Cincinnati, OH 45224
College Hill NeighborhoodEstimated Value: $233,000 - $288,000
4
Beds
3
Baths
1,872
Sq Ft
$135/Sq Ft
Est. Value
About This Home
This home is located at 6009 Waldway Ln, Cincinnati, OH 45224 and is currently estimated at $252,765, approximately $135 per square foot. 6009 Waldway Ln is a home located in Hamilton County with nearby schools including Pleasant Hill Elementary School, Shroder High School, and Western Hills High School.
Ownership History
Date
Name
Owned For
Owner Type
Purchase Details
Closed on
Dec 28, 2005
Sold by
Federal Home Loan Mortgage Corporation
Bought by
Black Margie M
Current Estimated Value
Home Financials for this Owner
Home Financials are based on the most recent Mortgage that was taken out on this home.
Original Mortgage
$96,500
Outstanding Balance
$53,398
Interest Rate
6.4%
Mortgage Type
Fannie Mae Freddie Mac
Estimated Equity
$199,367
Purchase Details
Closed on
Dec 28, 2004
Sold by
Russell Joe Edward and Russell Deborah L
Bought by
Federal Home Loan Mortgage Corporation
Purchase Details
Closed on
Dec 5, 1997
Sold by
Edwards Ruth M
Bought by
Russell Joseph and Russell Deborah L
Home Financials for this Owner
Home Financials are based on the most recent Mortgage that was taken out on this home.
Original Mortgage
$75,650
Interest Rate
7.36%
Purchase Details
Closed on
Jul 1, 1997
Sold by
Edwards Michael M
Bought by
Edwards Ruth M
Create a Home Valuation Report for This Property
The Home Valuation Report is an in-depth analysis detailing your home's value as well as a comparison with similar homes in the area
Home Values in the Area
Average Home Value in this Area
Purchase History
We collect this data history from publicly available records. To have your information removed, we recommend requesting removal directly through your county’s website.
| Date | Buyer | Sale Price | Title Company |
|---|---|---|---|
| Black Margie M | -- | None Available | |
| Federal Home Loan Mortgage Corporation | $77,000 | None Available | |
| Russell Joseph | $89,000 | -- | |
| Edwards Ruth M | -- | -- |
Source: Public Records
Mortgage History
We collect this data history from publicly available records. To have your information removed, we recommend requesting removal directly through your county’s website.
| Date | Status | Borrower | Loan Amount |
|---|---|---|---|
| Open | Black Margie M | $96,500 | |
| Previous Owner | Russell Joseph | $75,650 |
Source: Public Records
Tax History
| Year | Tax Paid | Tax Assessment Tax Assessment Total Assessment is a certain percentage of the fair market value that is determined by local assessors to be the total taxable value of land and additions on the property. | Land | Improvement |
|---|---|---|---|---|
| 2025 | $3,491 | $56,550 | $9,478 | $47,072 |
| 2024 | $3,385 | $56,550 | $9,478 | $47,072 |
| 2023 | $3,462 | $56,550 | $9,478 | $47,072 |
| 2022 | $2,478 | $36,236 | $7,718 | $28,518 |
| 2021 | $2,382 | $36,236 | $7,718 | $28,518 |
| 2020 | $2,451 | $36,236 | $7,718 | $28,518 |
| 2019 | $2,350 | $31,784 | $6,769 | $25,015 |
| 2018 | $2,354 | $31,784 | $6,769 | $25,015 |
| 2017 | $2,236 | $31,784 | $6,769 | $25,015 |
| 2016 | $2,454 | $34,416 | $7,224 | $27,192 |
| 2015 | $2,213 | $34,416 | $7,224 | $27,192 |
| 2014 | $2,229 | $34,416 | $7,224 | $27,192 |
| 2013 | $2,337 | $35,480 | $7,448 | $28,032 |
Source: Public Records
Map
Nearby Homes
- 6101 Capri Dr
- 6045 Tahiti Dr
- 5974 Sunridge Dr
- 1011 Venetian Terrace
- 939 Venetian Terrace
- 1078 Addice Way
- 997 W North Bend Rd
- 1197 Toluca Ct
- 6629 Charann Ln
- 5945 Leffingwell Ave
- 5735 Argus Rd
- 5947 Leffingwell Ave
- 6728 Sandalwood Ln
- 5940 Kenneth Ave
- 1162 Groesbeck Rd
- 1166 Groesbeck Rd
- 6621 Winton Rd
- 939 Winsray Ct
- 877 Oakfield Ave
- 5918 Lantana Ave
- 6005 Waldway Ln
- 6013 Waldway Ln
- 6017 Waldway Ln
- 6001 Waldway Ln
- 6072 Tahiti Dr
- 6080 Tahiti Dr
- 6068 Tahiti Dr
- 6021 Waldway Ln
- 6008 Waldway Ln
- 6004 Waldway Ln
- 6012 Waldway Ln
- 6086 Tahiti Dr
- 6016 Waldway Ln
- 6000 Waldway Ln
- 6025 Waldway Ln
- 6090 Tahiti Dr
- 6020 Waldway Ln
- 5999 Waldway Ln
- 6056 Tahiti Dr
- 6029 Waldway Ln
Your Personal Tour Guide
Ask me questions while you tour the home.