Estimated Value: $172,105 - $195,000
3
Beds
1
Bath
952
Sq Ft
$190/Sq Ft
Est. Value
About This Home
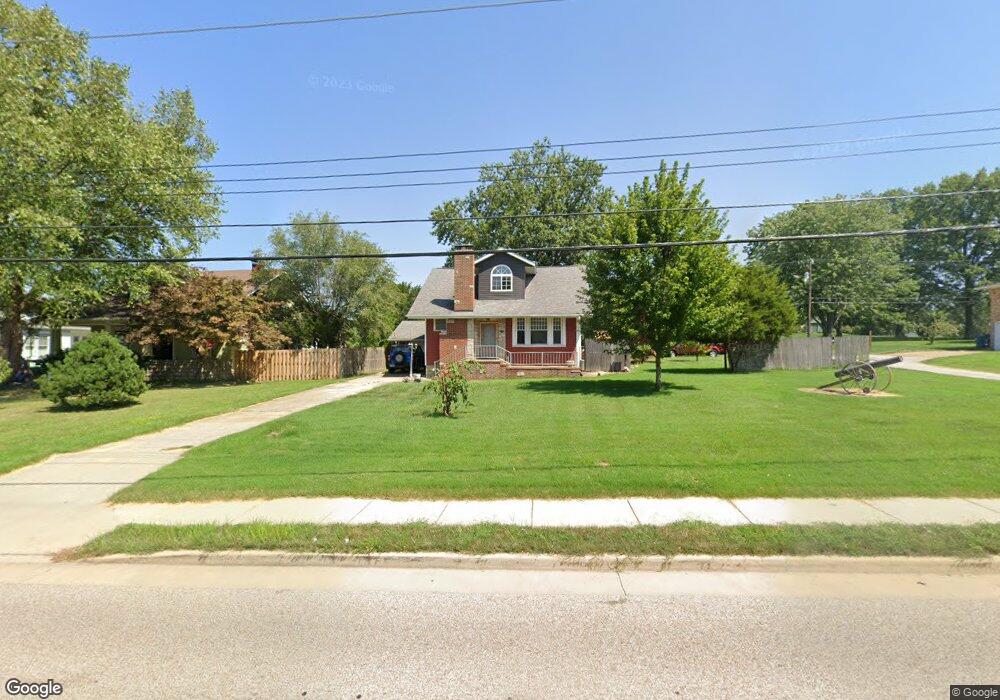
This home is located at 602 S Main St, Troy, IL 62294 and is currently estimated at $180,526, approximately $189 per square foot. 602 S Main St is a home located in Madison County with nearby schools including Henning Elementary School, Triad Middle School, and Triad High School.
Ownership History
Date
Name
Owned For
Owner Type
Purchase Details
Closed on
Oct 13, 2005
Sold by
Illinois Housing Development Authority
Bought by
Holmes Patricia L and Mullinix Jeffrey A
Current Estimated Value
Home Financials for this Owner
Home Financials are based on the most recent Mortgage that was taken out on this home.
Original Mortgage
$85,000
Outstanding Balance
$43,634
Interest Rate
5.8%
Mortgage Type
Fannie Mae Freddie Mac
Estimated Equity
$136,892
Purchase Details
Closed on
Jun 9, 2005
Sold by
Oller Rodney W and Oller Kariann
Bought by
Chase Home Finance Llc
Create a Home Valuation Report for This Property
The Home Valuation Report is an in-depth analysis detailing your home's value as well as a comparison with similar homes in the area
Home Values in the Area
Average Home Value in this Area
Purchase History
We collect this data history from publicly available records. To have your information removed, we recommend requesting removal directly through your county’s website.
| Date | Buyer | Sale Price | Title Company |
|---|---|---|---|
| Holmes Patricia L | -- | First Country Title Co | |
| Chase Home Finance Llc | $73,100 | -- |
Source: Public Records
Mortgage History
We collect this data history from publicly available records. To have your information removed, we recommend requesting removal directly through your county’s website.
| Date | Status | Borrower | Loan Amount |
|---|---|---|---|
| Open | Holmes Patricia L | $85,000 |
Source: Public Records
Tax History
| Year | Tax Paid | Tax Assessment Tax Assessment Total Assessment is a certain percentage of the fair market value that is determined by local assessors to be the total taxable value of land and additions on the property. | Land | Improvement |
|---|---|---|---|---|
| 2025 | $2,542 | $50,820 | $14,530 | $36,290 |
| 2024 | $2,542 | $47,390 | $13,550 | $33,840 |
| 2023 | $2,542 | $43,020 | $12,300 | $30,720 |
| 2022 | $2,657 | $39,620 | $11,330 | $28,290 |
| 2021 | $2,433 | $37,660 | $10,770 | $26,890 |
| 2020 | $2,427 | $36,690 | $10,490 | $26,200 |
| 2019 | $2,380 | $35,930 | $10,270 | $25,660 |
| 2018 | $2,308 | $33,280 | $9,510 | $23,770 |
| 2017 | $2,217 | $32,580 | $9,310 | $23,270 |
| 2016 | $2,194 | $32,580 | $9,310 | $23,270 |
| 2015 | $1,960 | $31,500 | $9,000 | $22,500 |
| 2014 | $1,960 | $31,500 | $9,000 | $22,500 |
| 2013 | $1,960 | $31,500 | $9,000 | $22,500 |
Source: Public Records
Map
Nearby Homes
- 706 Merlin Ct
- 716 Sundance Trail
- 313 S Park St
- 10 Arbor Springs
- 516 Lanahan Dr
- 111 Theresa Dr
- 103 Theresa Dr
- 1538 Sagaponak Ln
- 402 N Powell St
- 208 E Throp St
- 332 N Kimberlin St
- 9 Parklane Dr W
- 278 Shadowbrooke
- 1437 Guilford Place
- 82 W Lake Dr
- 1438 Montauk Rd
- xxx Lower Marine Rd
- Tbd Lower Marine Rd
- 8444 Cryder Lane Ct
- 24 Sonata Ln
Your Personal Tour Guide
Ask me questions while you tour the home.