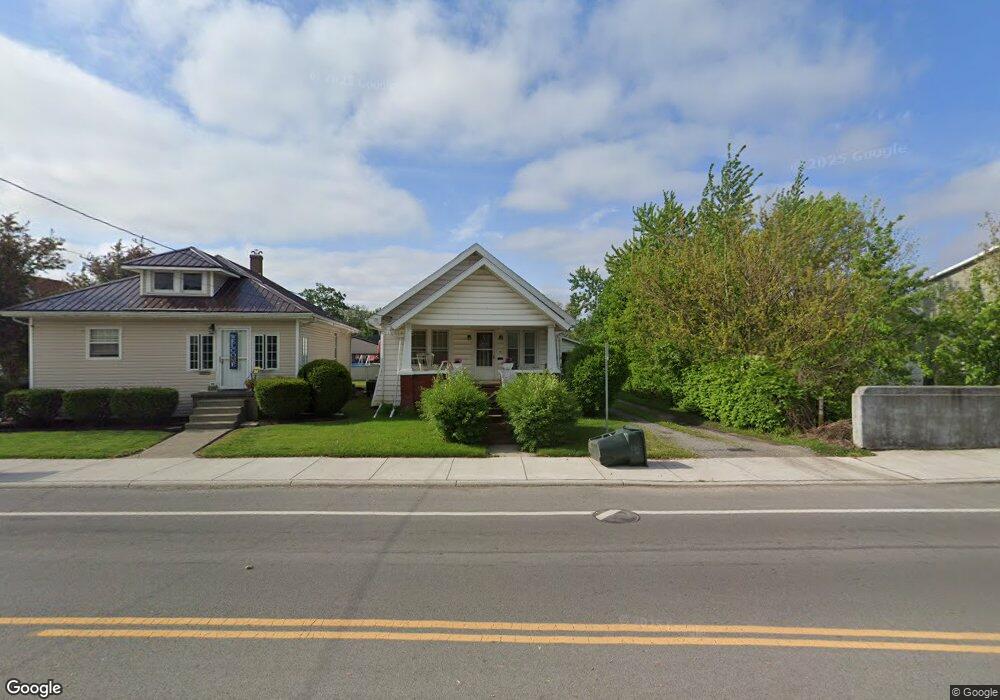
603 E 5th St Delphos, OH 45833
Estimated Value: $75,000 - $117,000
2
Beds
1
Bath
816
Sq Ft
$123/Sq Ft
Est. Value
About This Home
This home is located at 603 E 5th St, Delphos, OH 45833 and is currently estimated at $100,527, approximately $123 per square foot. 603 E 5th St is a home located in Allen County with nearby schools including Delphos St. John's High School and Delphos St. John's Elementary School.
Ownership History
Date
Name
Owned For
Owner Type
Purchase Details
Closed on
Dec 23, 2020
Sold by
Kollsmith James M and Kollsmith Rojean Y
Bought by
Kollsmith Christopher R
Current Estimated Value
Purchase Details
Closed on
Jan 17, 2010
Sold by
Kollsmith Christopher R
Bought by
Kollsmith James M and Kollsmith Rojean Y
Purchase Details
Closed on
Oct 24, 2008
Sold by
Kollsmith James M and Kollsmith Rojean Y
Bought by
Kollsmith Christopher R
Purchase Details
Closed on
Sep 3, 2008
Sold by
Brickman Jeanalice M
Bought by
Kollsmith James M and Kollsmith Rojean Y
Purchase Details
Closed on
Nov 12, 1991
Bought by
Brickman Mary Louise
Create a Home Valuation Report for This Property
The Home Valuation Report is an in-depth analysis detailing your home's value as well as a comparison with similar homes in the area
Home Values in the Area
Average Home Value in this Area
Purchase History
| Date | Buyer | Sale Price | Title Company |
|---|---|---|---|
| Kollsmith Christopher R | -- | None Available | |
| Kollsmith James M | -- | Attorney | |
| Kollsmith Christopher R | $33,600 | Attorney | |
| Kollsmith James M | $32,000 | Attorney | |
| Brickman Mary Louise | -- | -- |
Source: Public Records
Tax History
| Year | Tax Paid | Tax Assessment Tax Assessment Total Assessment is a certain percentage of the fair market value that is determined by local assessors to be the total taxable value of land and additions on the property. | Land | Improvement |
|---|---|---|---|---|
| 2024 | $897 | $28,000 | $7,140 | $20,860 |
| 2023 | $710 | $20,900 | $5,320 | $15,580 |
| 2022 | $727 | $20,900 | $5,320 | $15,580 |
| 2021 | $733 | $20,900 | $5,320 | $15,580 |
| 2020 | $640 | $19,330 | $5,080 | $14,250 |
| 2019 | $640 | $19,330 | $5,080 | $14,250 |
| 2018 | $638 | $19,330 | $5,080 | $14,250 |
| 2017 | $607 | $18,030 | $5,080 | $12,950 |
| 2016 | $621 | $18,030 | $5,080 | $12,950 |
| 2015 | $571 | $18,030 | $5,080 | $12,950 |
| 2014 | $571 | $16,810 | $4,870 | $11,940 |
| 2013 | $577 | $16,810 | $4,870 | $11,940 |
Source: Public Records
Map
Nearby Homes
- 821 E 3rd St
- 628 N Pierce St
- 201 E 5th St
- 610 N Washington St
- 702 N Main St
- 629 N Main St
- 221 S Main St
- 483 S Franklin St
- 424 S Canal St
- 709 W 4th St
- 537 / 539 Toomey
- 1000 Colettas Way
- 827 S Washington St
- 6800 N Defiance Trail
- 8448 Elida Rd
- 112 W Railroad St
- 608 N Adams St
- 3755 Grubb Rd N
- 0 N Conant Rd
- 19195 State Rd
Your Personal Tour Guide
Ask me questions while you tour the home.