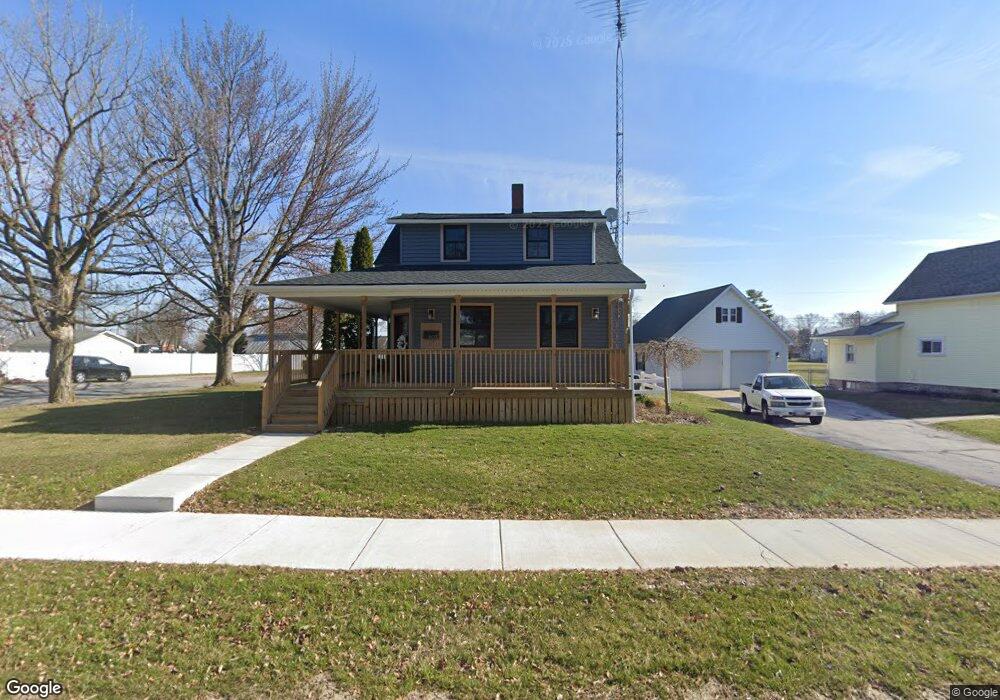
603 E Main St Leipsic, OH 45856
Estimated Value: $155,000 - $217,000
Studio
1
Bath
1,844
Sq Ft
$100/Sq Ft
Est. Value
About This Home
This home is located at 603 E Main St, Leipsic, OH 45856 and is currently estimated at $183,629, approximately $99 per square foot. 603 E Main St is a home located in Putnam County with nearby schools including Leipsic Elementary School, Leipsic High School, and St. Mary's Catholic School.
Ownership History
Date
Name
Owned For
Owner Type
Purchase Details
Closed on
May 26, 2015
Sold by
Eding Timothy E and Eding Jacie L
Bought by
Pingle Stephanie and Rodriguez Robert
Current Estimated Value
Home Financials for this Owner
Home Financials are based on the most recent Mortgage that was taken out on this home.
Original Mortgage
$73,150
Outstanding Balance
$56,393
Interest Rate
3.62%
Mortgage Type
New Conventional
Estimated Equity
$127,237
Purchase Details
Closed on
Oct 26, 2007
Sold by
Meyers Theodore F
Bought by
Eding Timothy E and Eding Jacie L
Create a Home Valuation Report for This Property
The Home Valuation Report is an in-depth analysis detailing your home's value as well as a comparison with similar homes in the area
Purchase History
| Date | Buyer | Sale Price | Title Company |
|---|---|---|---|
| Pingle Stephanie | $77,000 | Attorney | |
| Eding Timothy E | $65,000 | Whitman Title Security Inc |
Source: Public Records
Mortgage History
| Date | Status | Borrower | Loan Amount |
|---|---|---|---|
| Open | Pingle Stephanie | $73,150 |
Source: Public Records
Tax History
| Year | Tax Paid | Tax Assessment Tax Assessment Total Assessment is a certain percentage of the fair market value that is determined by local assessors to be the total taxable value of land and additions on the property. | Land | Improvement |
|---|---|---|---|---|
| 2025 | $2,459 | $47,860 | $5,240 | $42,620 |
| 2024 | $2,474 | $47,860 | $5,240 | $42,620 |
| 2023 | $1,540 | $34,970 | $4,050 | $30,920 |
| 2022 | $1,413 | $34,969 | $4,050 | $30,919 |
| 2021 | $1,420 | $34,970 | $4,050 | $30,920 |
| 2020 | $1,414 | $23,620 | $3,580 | $20,040 |
| 2019 | $1,140 | $27,570 | $4,050 | $23,520 |
| 2018 | $1,054 | $27,570 | $4,050 | $23,520 |
| 2017 | $837 | $27,570 | $4,050 | $23,520 |
| 2016 | $837 | $23,620 | $3,580 | $20,040 |
| 2015 | $823 | $23,620 | $3,580 | $20,040 |
| 2014 | $803 | $23,620 | $3,580 | $20,040 |
| 2013 | $828 | $23,620 | $3,580 | $20,040 |
Source: Public Records
Map
Nearby Homes
Your Personal Tour Guide
Ask me questions while you tour the home.