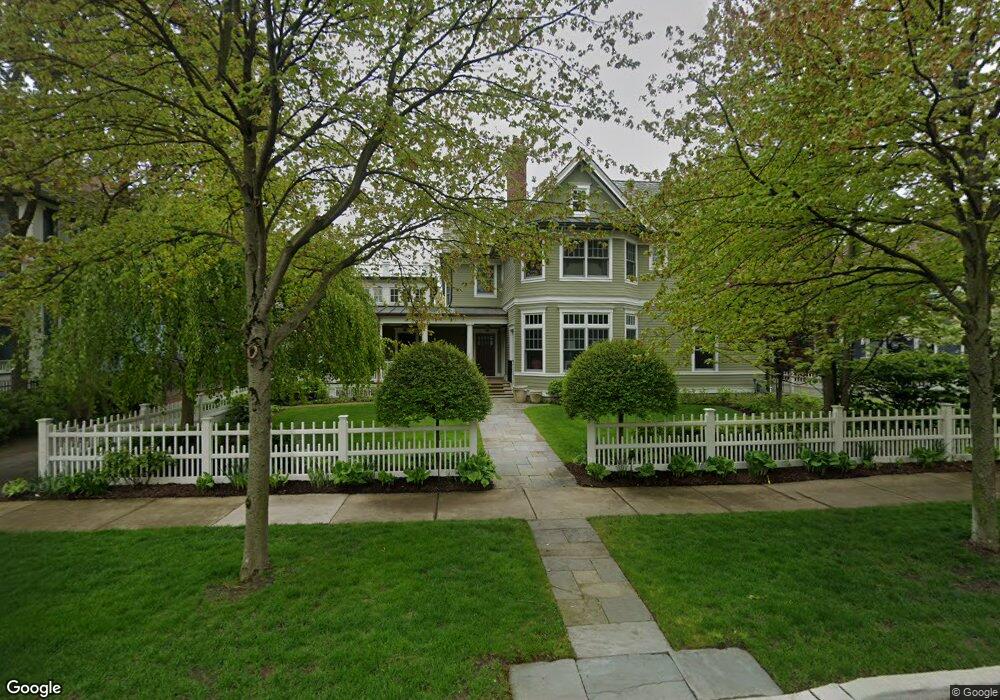
604 Cherry St Winnetka, IL 60093
Winnetka AreaEstimated Value: $2,988,000 - $4,434,000
About This Home
This home is located at 604 Cherry St, Winnetka, IL 60093 and is currently estimated at $3,863,769, approximately $663 per square foot. 604 Cherry St is a home located in Cook County with nearby schools including Greeley Elementary School, The Skokie School, and The Carleton W. Washburne School.
Ownership History
We collect this data history from publicly available records. To have your information removed, we recommend requesting removal directly through your county’s website.
Purchase Details
Home Financials for this Owner
Home Financials are based on the most recent Mortgage that was taken out on this home.Purchase Details
Home Values in the Area
Average Home Value in this Area
Purchase History
We collect this data history from publicly available records. To have your information removed, we recommend requesting removal directly through your county’s website.
| Date | Buyer | Sale Price | Title Company |
|---|---|---|---|
| $1,600,000 | Heritage Title Company | ||
| $796,000 | -- |
Mortgage History
We collect this data history from publicly available records. To have your information removed, we recommend requesting removal directly through your county’s website.
| Date | Status | Borrower | Loan Amount |
|---|---|---|---|
| Closed | $1,000,000 |
Tax History
We collect this data history from publicly available records. To have your information removed, we recommend requesting removal directly through your county’s website.
| Year | Tax Paid | Tax Assessment Tax Assessment Total Assessment is a certain percentage of the fair market value that is determined by local assessors to be the total taxable value of land and additions on the property. | Land | Improvement |
|---|---|---|---|---|
| 2025 | $66,372 | $350,001 | $47,210 | $302,791 |
| 2024 | $66,372 | $289,608 | $57,701 | $231,907 |
| 2023 | $62,461 | $289,608 | $57,701 | $231,907 |
| 2022 | $62,461 | $289,608 | $57,701 | $231,907 |
| 2021 | $59,453 | $232,415 | $39,341 | $193,074 |
| 2020 | $58,564 | $232,415 | $39,341 | $193,074 |
| 2019 | $58,111 | $252,625 | $39,341 | $213,284 |
| 2018 | $54,395 | $230,214 | $34,095 | $196,119 |
| 2017 | $59,488 | $259,291 | $34,095 | $225,196 |
| 2016 | $56,853 | $259,291 | $34,095 | $225,196 |
| 2015 | $54,603 | $224,556 | $28,413 | $196,143 |
| 2014 | $53,444 | $224,556 | $28,413 | $196,143 |
| 2013 | $50,962 | $224,556 | $28,413 | $196,143 |
Map
- 455 Sheridan Rd
- 654 Pine St
- 605 Arbor Vitae Rd
- 785 Mount Pleasant St
- 639 Lincoln Ave
- 478 Sunset Rd
- 882 Willow Rd
- 319 Sheridan Rd
- 922 Ash St
- 134 Green Bay Rd Unit 104
- 650 Winnetka Mews Unit 310
- 915 Sunset Rd
- 510 Provident Ave
- 936 Sunset Rd
- 72 Warwick Rd
- 1037 Oak St
- 919 Hill Rd
- 376 Rosewood Ave
- 1050 Spruce St
- 1087 Ash St
Ask me questions while you tour the home.