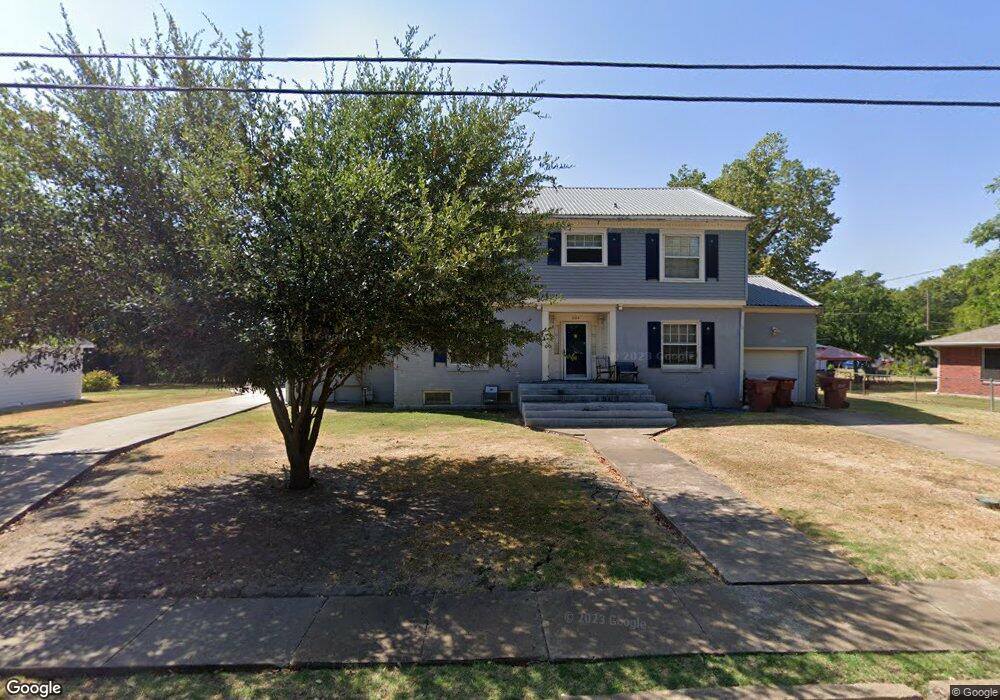
604 E 12th St Bonham, TX 75418
Estimated Value: $240,000 - $389,000
4
Beds
3
Baths
3,502
Sq Ft
$83/Sq Ft
Est. Value
About This Home
This home is located at 604 E 12th St, Bonham, TX 75418 and is currently estimated at $291,645, approximately $83 per square foot. 604 E 12th St is a home located in Fannin County with nearby schools including Evans Elementary School, Finley-Oates Elementary School, and LH Rather Jr High School.
Ownership History
Date
Name
Owned For
Owner Type
Purchase Details
Closed on
Feb 10, 2006
Sold by
Bank One National Assn
Bought by
Mcfarland Ricky L and Mcfarland Christina A
Current Estimated Value
Home Financials for this Owner
Home Financials are based on the most recent Mortgage that was taken out on this home.
Original Mortgage
$72,800
Interest Rate
6.24%
Mortgage Type
Stand Alone Second
Create a Home Valuation Report for This Property
The Home Valuation Report is an in-depth analysis detailing your home's value as well as a comparison with similar homes in the area
Purchase History
| Date | Buyer | Sale Price | Title Company |
|---|---|---|---|
| Mcfarland Ricky L | -- | None Available |
Source: Public Records
Mortgage History
| Date | Status | Borrower | Loan Amount |
|---|---|---|---|
| Previous Owner | Mcfarland Ricky L | $72,800 |
Source: Public Records
Tax History
| Year | Tax Paid | Tax Assessment Tax Assessment Total Assessment is a certain percentage of the fair market value that is determined by local assessors to be the total taxable value of land and additions on the property. | Land | Improvement |
|---|---|---|---|---|
| 2025 | $5,048 | $286,510 | $70,130 | $216,380 |
| 2024 | $1,910 | $281,900 | $69,260 | $212,640 |
| 2023 | $4,241 | $270,750 | $55,930 | $214,820 |
| 2022 | $4,300 | $245,410 | $40,350 | $205,060 |
| 2021 | $4,493 | $177,760 | $18,700 | $159,060 |
| 2020 | $4,389 | $177,650 | $16,800 | $160,850 |
| 2019 | $4,148 | $170,610 | $8,310 | $162,300 |
| 2018 | $3,766 | $155,750 | $7,100 | $148,650 |
| 2017 | $3,297 | $133,520 | $7,100 | $126,420 |
| 2016 | $2,997 | $117,270 | $7,100 | $110,170 |
| 2015 | -- | $106,890 | $6,750 | $100,140 |
| 2014 | -- | $108,750 | $5,450 | $103,300 |
Source: Public Records
Map
Nearby Homes
Your Personal Tour Guide
Ask me questions while you tour the home.