Estimated Value: $812,000 - $943,000
3
Beds
4
Baths
2,307
Sq Ft
$379/Sq Ft
Est. Value
About This Home
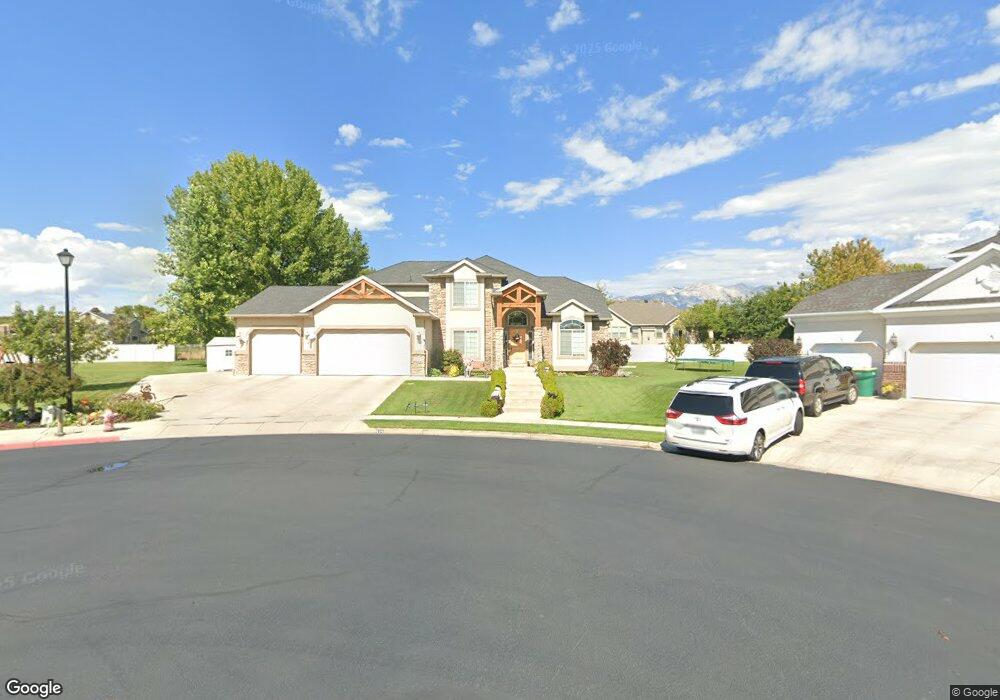
This home is located at 604 N 1520 E, Lehi, UT 84043 and is currently estimated at $874,689, approximately $379 per square foot. 604 N 1520 E is a home located in Utah County with nearby schools including Sego Lily Elementary School, Lehi Junior High School, and Skyridge High School.
Ownership History
Date
Name
Owned For
Owner Type
Purchase Details
Closed on
Jul 7, 2011
Sold by
Oswald Philip D and Oswald Anne H
Bought by
Oswald Philip and Oswald Anne
Current Estimated Value
Purchase Details
Closed on
Jul 17, 2006
Sold by
Ivory Homes Ltd
Bought by
Oswald Philip D and Oswald Anne H
Home Financials for this Owner
Home Financials are based on the most recent Mortgage that was taken out on this home.
Original Mortgage
$200,000
Outstanding Balance
$118,210
Interest Rate
6.57%
Mortgage Type
Purchase Money Mortgage
Estimated Equity
$756,479
Create a Home Valuation Report for This Property
The Home Valuation Report is an in-depth analysis detailing your home's value as well as a comparison with similar homes in the area
Home Values in the Area
Average Home Value in this Area
Purchase History
| Date | Buyer | Sale Price | Title Company |
|---|---|---|---|
| Oswald Philip | -- | None Available | |
| Oswald Philip D | -- | Cottonwood Title | |
| Ivory Homes Ltd | -- | Cottonwood Title |
Source: Public Records
Mortgage History
| Date | Status | Borrower | Loan Amount |
|---|---|---|---|
| Open | Oswald Philip D | $200,000 |
Source: Public Records
Tax History
| Year | Tax Paid | Tax Assessment Tax Assessment Total Assessment is a certain percentage of the fair market value that is determined by local assessors to be the total taxable value of land and additions on the property. | Land | Improvement |
|---|---|---|---|---|
| 2025 | $3,538 | $474,760 | -- | -- |
| 2024 | $3,538 | $413,985 | $0 | $0 |
| 2023 | $3,214 | $408,430 | $0 | $0 |
| 2022 | $3,636 | $447,865 | $0 | $0 |
| 2021 | $3,271 | $609,100 | $179,500 | $429,600 |
| 2020 | $3,084 | $567,700 | $166,200 | $401,500 |
| 2019 | $2,693 | $515,300 | $166,200 | $349,100 |
| 2018 | $2,741 | $495,900 | $146,800 | $349,100 |
| 2017 | $2,596 | $249,700 | $0 | $0 |
| 2016 | $2,574 | $229,680 | $0 | $0 |
| 2015 | $2,583 | $218,790 | $0 | $0 |
| 2014 | $2,427 | $204,380 | $0 | $0 |
Source: Public Records
Map
Nearby Homes
- 551 N 1520 E
- 556 N 1440 E
- 499 N 1520 E
- 422 N 1322 E
- 893 N 1580 E
- 822 N 860 W Unit 317
- 3947 W 1000 N Unit 439
- 3959 W 1000 N
- 3995 W 1000 N
- 808 N 860 W
- 822 W 800 St N Unit LOT319
- 1785 E 900 N
- 764 W 880 North St Unit 308
- 1635 E 1060 N
- 1175 E 900 N
- 672 W 900 N
- 952 N 680 W
- 524 N 900 E
- 1076 W State Rd Unit 204
- 484 N 950 W Unit 7
Your Personal Tour Guide
Ask me questions while you tour the home.