N
Seller's Agent in 2021
Norman Domingo
XRealty.NetLLC
(888) 838-9044
1,118 Total Sales


Estimated Value: $163,000 - $252,000
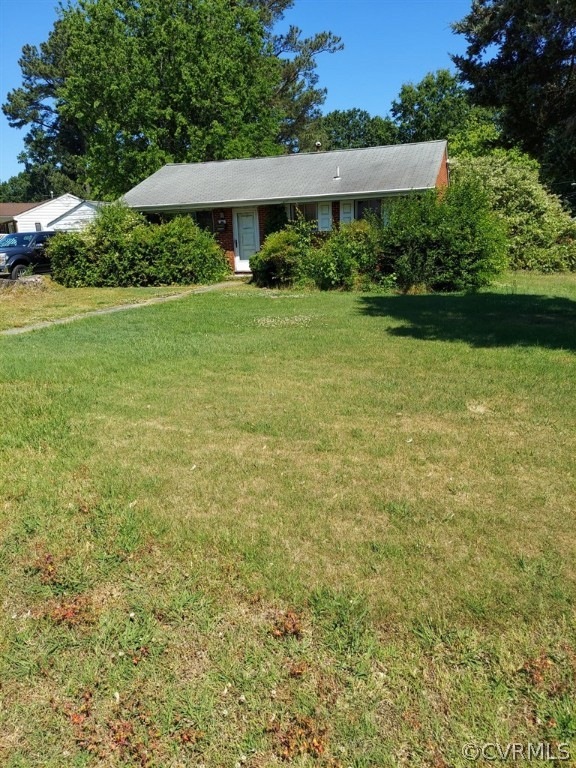
Property being sold ‘’as-is’ and ‘’where-is’’.
Last Agent to Sell the Property
XRealty.NetLLC License #0225194372 Listed on: 05/28/2021
Last Buyer's Agent
NON MLS USER MLS
NON MLS OFFICE
We collect this data history from publicly available records. To have your information removed, we recommend requesting removal directly through your county’s website.
We collect this data history from publicly available records. To have your information removed, we recommend requesting removal directly through your county’s website.
| Date | Buyer | Sale Price | Title Company |
|---|---|---|---|
| $108,000 | Attorney |
We collect this data history from publicly available records. To have your information removed, we recommend requesting removal directly through your county’s website.
| Date | Status | Borrower | Loan Amount |
|---|---|---|---|
| Open | $150,000 | ||
| Closed | $120,250 | ||
| Previous Owner | $74,841 |
We collect this data history from publicly available records. To have your information removed, we recommend requesting removal directly through your county’s website.
| Date | Event | Price | List to Sale | Price per Sq Ft |
|---|---|---|---|---|
| 07/09/2021 07/09/21 | Sold | $120,000 | -4.2% | $80 / Sq Ft |
| 06/04/2021 06/04/21 | Pending | -- | -- | -- |
| 05/28/2021 05/28/21 | For Sale | $125,316 | -- | $83 / Sq Ft |
We collect this data history from publicly available records. To have your information removed, we recommend requesting removal directly through your county’s website.
| Year | Tax Paid | Tax Assessment Tax Assessment Total Assessment is a certain percentage of the fair market value that is determined by local assessors to be the total taxable value of land and additions on the property. | Land | Improvement |
|---|---|---|---|---|
| 2026 | $2,176 | $181,300 | $50,000 | $131,300 |
| 2025 | $2,046 | $158,900 | $48,000 | $110,900 |
| 2024 | $2,011 | $158,900 | $48,000 | $110,900 |
| 2023 | $1,585 | $132,100 | $40,000 | $92,100 |
| 2022 | $2,355 | $132,100 | $40,000 | $92,100 |
| 2021 | $670 | $111,600 | $36,000 | $75,600 |
| 2020 | $1,339 | $111,600 | $36,000 | $75,600 |
| 2019 | $1,231 | $102,600 | $32,500 | $70,100 |
| 2018 | $1,231 | $102,600 | $32,500 | $70,100 |
| 2017 | $1,172 | $0 | $0 | $0 |
| 2016 | $1,114 | $97,700 | $0 | $0 |
| 2015 | $588 | $0 | $0 | $0 |
| 2014 | $588 | $0 | $0 | $0 |
N
Seller's Agent in 2021
Norman Domingo
XRealty.NetLLC
(888) 838-9044
1,118 Total Sales
N
Buyer's Agent in 2021
NON MLS USER MLS
NON MLS OFFICE
Source: Central Virginia Regional MLS
MLS Number: 2116080
APN: 45000400026
Disclaimer: Certain information contained herein is derived from information provided by parties other than Homes.com. All information provided is deemed reliable, but is not guaranteed to be accurate and should be independently verified.
![]() All or a portion of th multiple Listing information is provided by the Central Virginia Regional Multiple Listing Service, LLC, from a copyrighted compilation of Listing s. All CVR MLS information provided is deemed reliable but is not guaranteed accurate. The compilation of Listings and each individual Listing are ©2026 Central Virginia Regional Multiple Listing Service, LLC. All rights reserved.
All or a portion of th multiple Listing information is provided by the Central Virginia Regional Multiple Listing Service, LLC, from a copyrighted compilation of Listing s. All CVR MLS information provided is deemed reliable but is not guaranteed accurate. The compilation of Listings and each individual Listing are ©2026 Central Virginia Regional Multiple Listing Service, LLC. All rights reserved.
Ask me questions while you tour the home.
