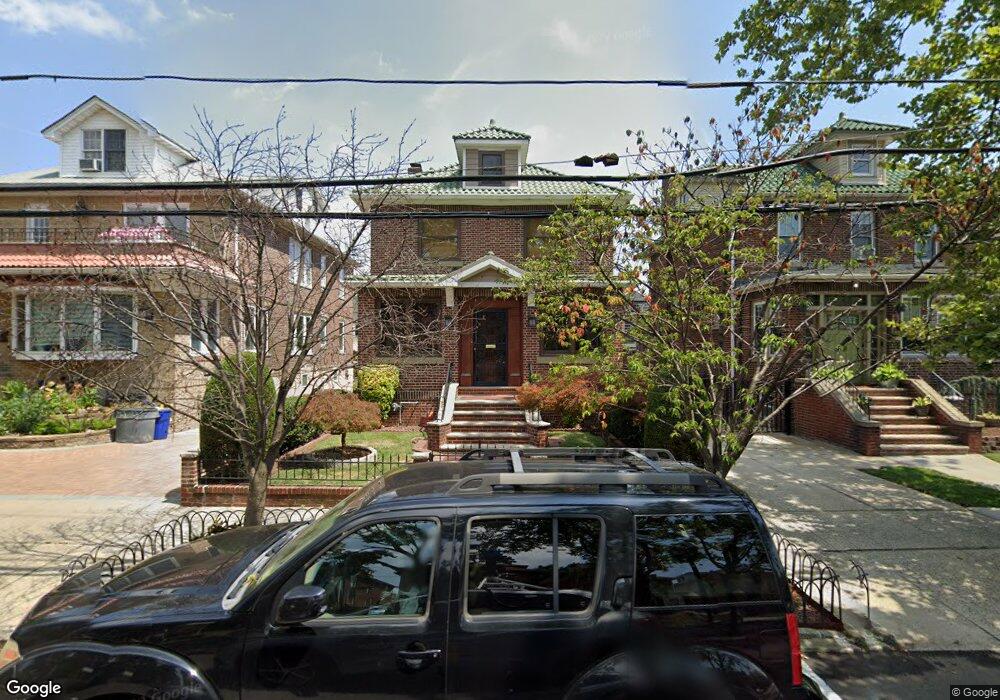
608 79th St North Bergen, NJ 07047
Estimated Value: $997,482 - $1,105,000
Studio
--
Bath
2,875
Sq Ft
$365/Sq Ft
Est. Value
About This Home
This home is located at 608 79th St, North Bergen, NJ 07047 and is currently estimated at $1,050,371, approximately $365 per square foot. 608 79th St is a home located in Hudson County with nearby schools including North Bergen High School and St. Joseph of the Palisades Elementary School.
Ownership History
Date
Name
Owned For
Owner Type
Purchase Details
Closed on
Apr 9, 1999
Sold by
Lorenzo Manuel
Bought by
Rodriguez Ii Mario M and Rodriguez Maria E
Current Estimated Value
Home Financials for this Owner
Home Financials are based on the most recent Mortgage that was taken out on this home.
Original Mortgage
$160,000
Outstanding Balance
$40,515
Interest Rate
7.04%
Mortgage Type
Stand Alone First
Estimated Equity
$1,009,856
Purchase Details
Closed on
Sep 10, 1996
Sold by
Lorenzo Manuel
Bought by
Lorenzo Manuel and Lorenzo Elba
Create a Home Valuation Report for This Property
The Home Valuation Report is an in-depth analysis detailing your home's value as well as a comparison with similar homes in the area
Home Values in the Area
Average Home Value in this Area
Purchase History
| Date | Buyer | Sale Price | Title Company |
|---|---|---|---|
| Rodriguez Ii Mario M | $252,000 | -- | |
| Lorenzo Manuel | -- | -- |
Source: Public Records
Mortgage History
| Date | Status | Borrower | Loan Amount |
|---|---|---|---|
| Open | Rodriguez Ii Mario M | $160,000 |
Source: Public Records
Tax History
| Year | Tax Paid | Tax Assessment Tax Assessment Total Assessment is a certain percentage of the fair market value that is determined by local assessors to be the total taxable value of land and additions on the property. | Land | Improvement |
|---|---|---|---|---|
| 2025 | $13,983 | $800,400 | $355,000 | $445,400 |
| 2024 | $13,031 | $800,400 | $355,000 | $445,400 |
| 2023 | $13,031 | $800,400 | $355,000 | $445,400 |
| 2022 | $12,638 | $800,400 | $355,000 | $445,400 |
| 2021 | $11,027 | $188,400 | $91,000 | $97,400 |
| 2020 | $10,799 | $188,400 | $91,000 | $97,400 |
| 2019 | $10,788 | $188,400 | $91,000 | $97,400 |
| 2018 | $10,618 | $188,400 | $91,000 | $97,400 |
| 2017 | $10,420 | $188,400 | $91,000 | $97,400 |
| 2016 | $10,300 | $188,400 | $91,000 | $97,400 |
| 2015 | $9,968 | $188,400 | $91,000 | $97,400 |
| 2014 | $9,872 | $188,400 | $91,000 | $97,400 |
Source: Public Records
Map
Nearby Homes
- 708 79th St
- 509 81st St
- 435 79th St Unit 47
- 7803 5th Ave
- 7704 John F. Kennedy Blvd
- 7501 3rd Ave
- 8222 Kennedy Blvd
- 7701 Smith Ave
- 7405 2nd Ave
- 1100 83rd St Unit C3
- 1100 83rd St Unit C1
- 7430 Kennedy Blvd Unit 103
- 800 85th St
- 407 77th St
- 615 74th St
- 8519 1st Ave
- 8521 1st Ave
- 8600 1st Ave Unit B3
- 7505 Palisade Ave Unit 201
- 1227 83rd St
Your Personal Tour Guide
Ask me questions while you tour the home.