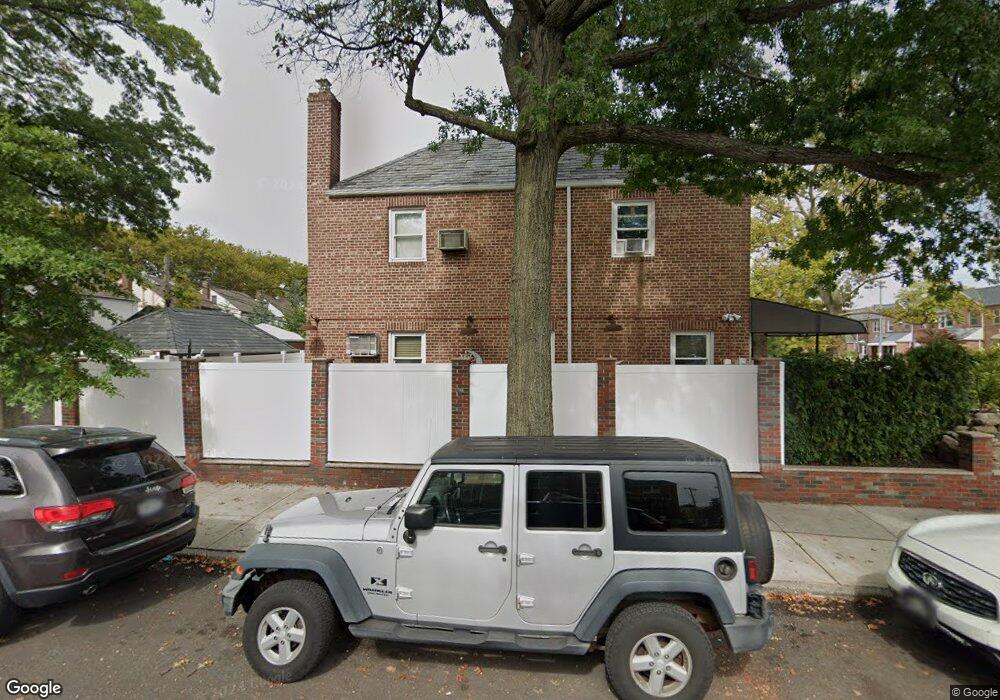
6082 70th St Maspeth, NY 11378
Maspeth NeighborhoodEstimated Value: $860,000 - $1,138,000
Studio
2
Baths
1,440
Sq Ft
$692/Sq Ft
Est. Value
About This Home
This home is located at 6082 70th St, Maspeth, NY 11378 and is currently estimated at $996,624, approximately $692 per square foot. 6082 70th St is a home located in Queens County with nearby schools including Ps 58 School Of Heroes, IS 73 - The Frank Sansivieri School, and Grover Cleveland High School.
Ownership History
Date
Name
Owned For
Owner Type
Purchase Details
Closed on
Dec 7, 2006
Sold by
Rossi Mary F and Rossi Peter W
Bought by
Mancini Maria and Palmato Elio B
Current Estimated Value
Home Financials for this Owner
Home Financials are based on the most recent Mortgage that was taken out on this home.
Original Mortgage
$172,000
Outstanding Balance
$102,010
Interest Rate
6.35%
Estimated Equity
$894,614
Create a Home Valuation Report for This Property
The Home Valuation Report is an in-depth analysis detailing your home's value as well as a comparison with similar homes in the area
Home Values in the Area
Average Home Value in this Area
Purchase History
| Date | Buyer | Sale Price | Title Company |
|---|---|---|---|
| Mancini Maria | $620,000 | -- | |
| Mancini Maria | $620,000 | -- |
Source: Public Records
Mortgage History
| Date | Status | Borrower | Loan Amount |
|---|---|---|---|
| Open | Mancini Maria | $172,000 | |
| Closed | Mancini Maria | $172,000 | |
| Open | Mancini Maria | $417,000 | |
| Closed | Mancini Maria | $417,000 |
Source: Public Records
Tax History
| Year | Tax Paid | Tax Assessment Tax Assessment Total Assessment is a certain percentage of the fair market value that is determined by local assessors to be the total taxable value of land and additions on the property. | Land | Improvement |
|---|---|---|---|---|
| 2025 | $7,836 | $41,275 | $15,933 | $25,342 |
| 2024 | $7,848 | $40,415 | $16,016 | $24,399 |
| 2023 | $7,404 | $38,263 | $13,788 | $24,475 |
| 2022 | $6,923 | $49,860 | $17,880 | $31,980 |
| 2021 | $6,943 | $52,740 | $17,880 | $34,860 |
| 2020 | $6,985 | $52,980 | $17,880 | $35,100 |
| 2019 | $6,752 | $53,040 | $17,880 | $35,160 |
| 2018 | $6,202 | $31,886 | $11,560 | $20,326 |
| 2017 | $5,836 | $30,097 | $12,236 | $17,861 |
| 2016 | $5,420 | $30,097 | $12,236 | $17,861 |
| 2015 | $3,205 | $28,663 | $15,107 | $13,556 |
| 2014 | $3,205 | $28,066 | $15,719 | $12,347 |
Source: Public Records
Map
Nearby Homes
Your Personal Tour Guide
Ask me questions while you tour the home.