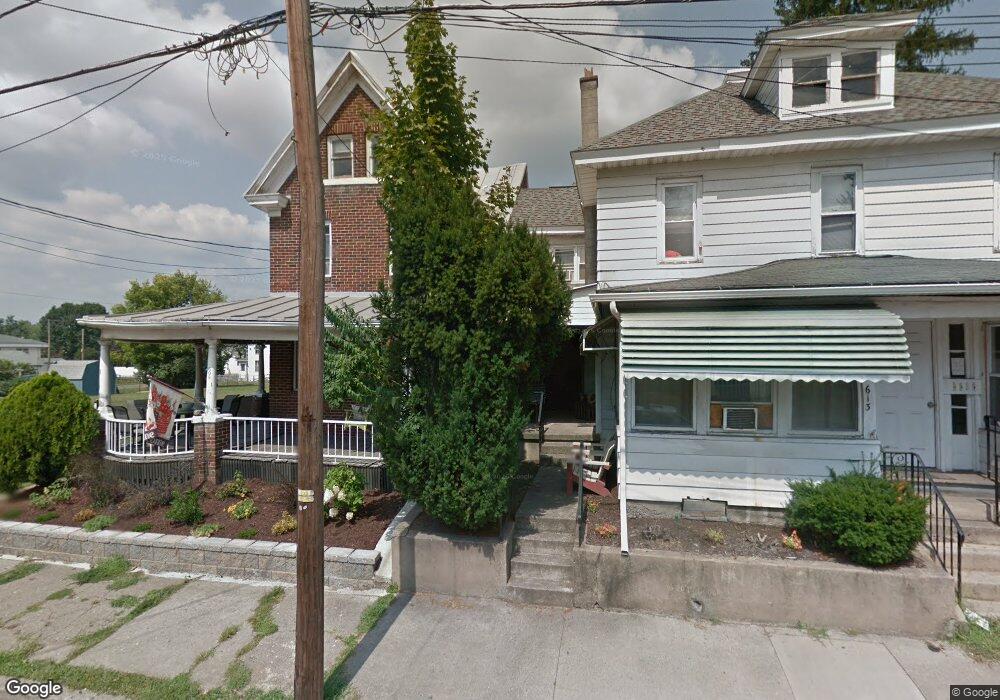
609 E 3rd St Nescopeck, PA 18635
Estimated Value: $159,033 - $273,000
Studio
--
Bath
1,908
Sq Ft
$110/Sq Ft
Est. Value
About This Home
This home is located at 609 E 3rd St, Nescopeck, PA 18635 and is currently estimated at $210,508, approximately $110 per square foot. 609 E 3rd St is a home located in Luzerne County with nearby schools including Berwick Area High School, Holy Family Consolidated School, and New Story School.
Ownership History
Date
Name
Owned For
Owner Type
Purchase Details
Closed on
Nov 10, 2023
Sold by
Newburgh Jeffrey M and Newburgh Elyse M
Bought by
Elff Properties Llc
Current Estimated Value
Purchase Details
Closed on
Sep 17, 2015
Sold by
Rinehimer Randall and Rinehimer Mollie J
Bought by
Newburgh Jeffrey M and Newburgh Elyse M
Purchase Details
Closed on
Jun 10, 2014
Sold by
Fannie Mae
Bought by
Rinehimer Randall
Purchase Details
Closed on
Apr 25, 2014
Sold by
Pawlowski Allan L
Bought by
Federal National Mortgage Association
Create a Home Valuation Report for This Property
The Home Valuation Report is an in-depth analysis detailing your home's value as well as a comparison with similar homes in the area
Home Values in the Area
Average Home Value in this Area
Purchase History
| Date | Buyer | Sale Price | Title Company |
|---|---|---|---|
| Elff Properties Llc | -- | Multi County Land Abstract | |
| Newburgh Jeffrey M | -- | None Available | |
| Rinehimer Randall | $45,000 | None Available | |
| Federal National Mortgage Association | $1,289 | None Available |
Source: Public Records
Tax History
| Year | Tax Paid | Tax Assessment Tax Assessment Total Assessment is a certain percentage of the fair market value that is determined by local assessors to be the total taxable value of land and additions on the property. | Land | Improvement |
|---|---|---|---|---|
| 2026 | $1,939 | $85,100 | $18,400 | $66,700 |
| 2025 | $1,912 | $85,100 | $18,400 | $66,700 |
| 2024 | $1,855 | $85,100 | $18,400 | $66,700 |
| 2023 | $1,781 | $85,100 | $18,400 | $66,700 |
| 2022 | $1,765 | $85,100 | $18,400 | $66,700 |
| 2021 | $1,629 | $85,100 | $18,400 | $66,700 |
| 2020 | $1,579 | $85,100 | $18,400 | $66,700 |
| 2019 | $1,568 | $85,100 | $18,400 | $66,700 |
| 2018 | $1,557 | $85,100 | $18,400 | $66,700 |
| 2017 | $1,618 | $85,100 | $18,400 | $66,700 |
| 2016 | -- | $132,300 | $18,400 | $113,900 |
| 2015 | -- | $132,300 | $18,400 | $113,900 |
| 2014 | -- | $132,300 | $18,400 | $113,900 |
Source: Public Records
Map
Nearby Homes
Your Personal Tour Guide
Ask me questions while you tour the home.