61 Appleton St Brockton, MA 02301
Estimated Value: $732,000 - $832,000
About This Home
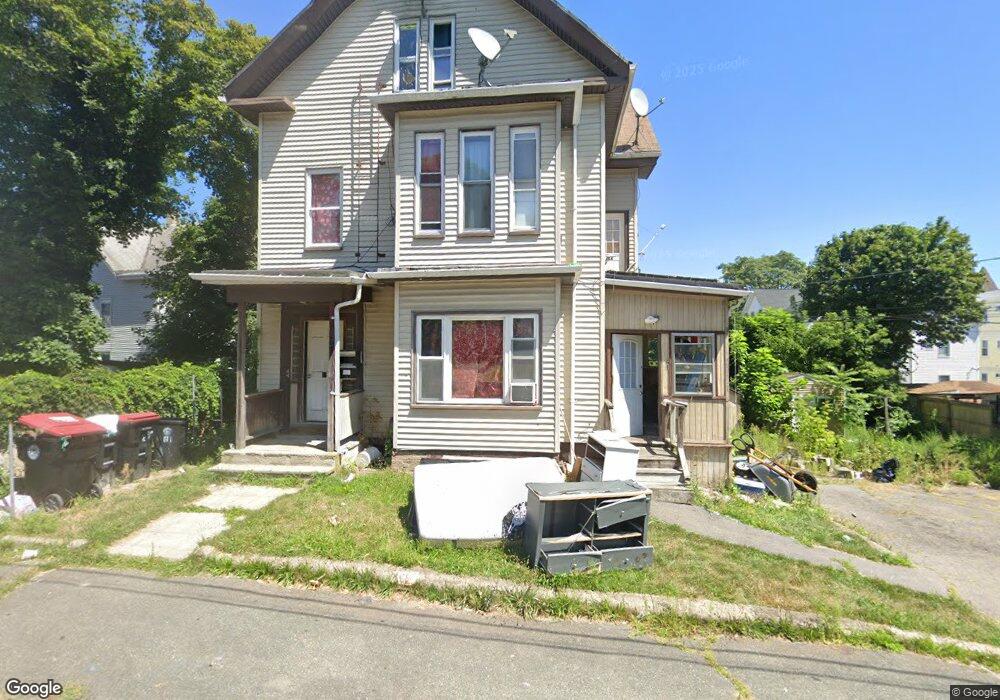
This home is located at 61 Appleton St, Brockton, MA 02301 and is currently estimated at $768,000, approximately $277 per square foot. 61 Appleton St is a home located in Plymouth County with nearby schools including Louis F Angelo Elementary School, Manthala George Jr. School, and Raymond K-8 Elementary School.
Ownership History
We collect this data history from publicly available records. To have your information removed, we recommend requesting removal directly through your county’s website.
Purchase Details
Home Financials for this Owner
Home Financials are based on the most recent Mortgage that was taken out on this home.Purchase History
We collect this data history from publicly available records. To have your information removed, we recommend requesting removal directly through your county’s website.
| Date | Buyer | Sale Price | Title Company |
|---|---|---|---|
| $47,000 | -- |
Mortgage History
We collect this data history from publicly available records. To have your information removed, we recommend requesting removal directly through your county’s website.
| Date | Status | Borrower | Loan Amount |
|---|---|---|---|
| Open | $200,000 | ||
| Closed | $150,000 | ||
| Closed | $32,900 |
Tax History
We collect this data history from publicly available records. To have your information removed, we recommend requesting removal directly through your county’s website.
| Year | Tax Paid | Tax Assessment Tax Assessment Total Assessment is a certain percentage of the fair market value that is determined by local assessors to be the total taxable value of land and additions on the property. | Land | Improvement |
|---|---|---|---|---|
| 2025 | $7,679 | $634,100 | $140,100 | $494,000 |
| 2024 | $7,535 | $626,900 | $140,100 | $486,800 |
| 2023 | $7,675 | $591,300 | $104,500 | $486,800 |
| 2022 | $7,079 | $506,700 | $95,000 | $411,700 |
| 2021 | $6,460 | $445,500 | $78,900 | $366,600 |
| 2020 | $5,636 | $372,000 | $73,900 | $298,100 |
| 2019 | $6,154 | $396,000 | $72,100 | $323,900 |
| 2018 | $4,948 | $308,100 | $72,100 | $236,000 |
| 2017 | $5,065 | $314,600 | $72,100 | $242,500 |
| 2016 | $4,304 | $247,900 | $69,900 | $178,000 |
| 2015 | $3,703 | $204,000 | $69,900 | $134,100 |
| 2014 | $3,608 | $199,000 | $69,900 | $129,100 |
Map
- 28 Prospect St
- 69 Huntington St
- 32 Milton St
- 112 Ford St
- 18 Washburn Ave
- 194 Prospect St
- 12 Charles St
- 56 N Warren Ave
- 380 N Montello St
- 189 Pleasant St
- 95 Prospect Terrace
- 88 Weston St
- 19 Glenwood St
- 65 E Ashland St
- 7 Main St Unit 203
- 185 Spring St
- 84 Emmet St
- 48 Simmons Ave
- 146 Court St Unit 604
- 35 Eagle Ave Unit 7
- 58 Appleton St
- 52 Appleton St
- 52 Appleton St Unit 1
- 62 Appleton St
- 66 Appleton St
- 46 Appleton St
- 46 Appleton St Unit 2
- 94 Prospect St
- 125 Walnut St
- 44 Appleton St
- 121 Walnut St
- 121 Walnut St Unit 2
- 55 Appleton St
- 55 Appleton St Unit 2
- 55 Appleton St Unit 1
- 49 Appleton St
- 131 Walnut St
- 84 Prospect St
- 115 Walnut St
- 80 Prospect St
Ask me questions while you tour the home.