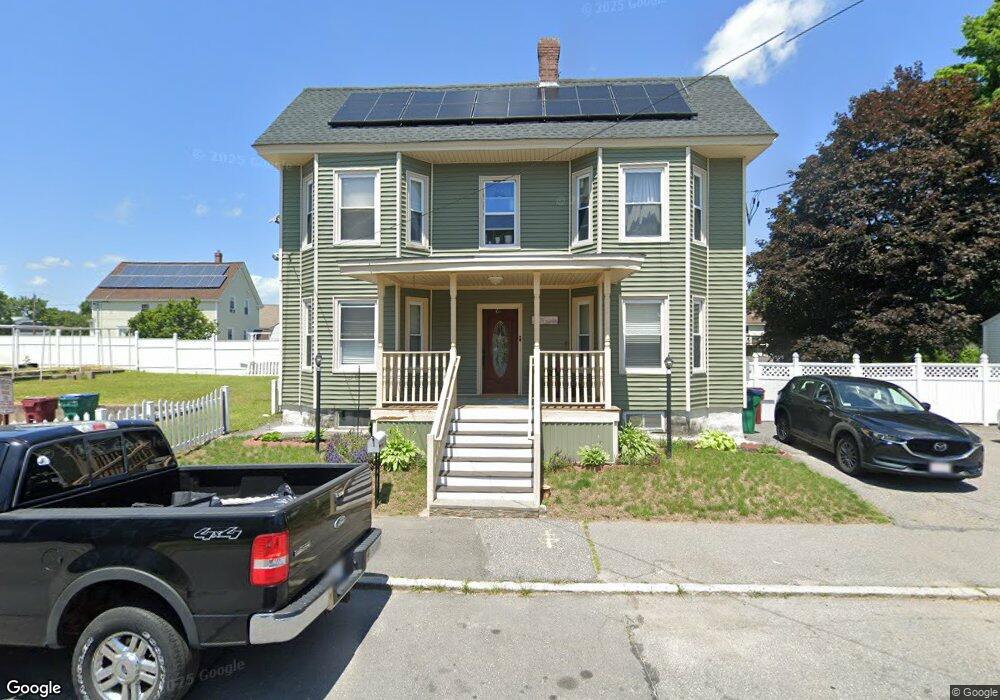
61 Bodwell Ave Lowell, MA 01854
Pawtucketville NeighborhoodEstimated Value: $693,000 - $810,000
7
Beds
3
Baths
2,981
Sq Ft
$247/Sq Ft
Est. Value
About This Home
This home is located at 61 Bodwell Ave, Lowell, MA 01854 and is currently estimated at $735,698, approximately $246 per square foot. 61 Bodwell Ave is a home located in Middlesex County with nearby schools including Joseph McAvinnue Elementary School, Charlotte M. Murkland Elementary School, and Charles W. Morey Elementary School.
Ownership History
Date
Name
Owned For
Owner Type
Purchase Details
Closed on
Mar 6, 2015
Sold by
Muriel Elkin E
Bought by
Valencia Olga L
Current Estimated Value
Create a Home Valuation Report for This Property
The Home Valuation Report is an in-depth analysis detailing your home's value as well as a comparison with similar homes in the area
Home Values in the Area
Average Home Value in this Area
Purchase History
We collect this data history from publicly available records. To have your information removed, we recommend requesting removal directly through your county’s website.
| Date | Buyer | Sale Price | Title Company |
|---|---|---|---|
| Valencia Olga L | -- | -- | |
| Valencia Olga L | -- | -- |
Source: Public Records
Mortgage History
We collect this data history from publicly available records. To have your information removed, we recommend requesting removal directly through your county’s website.
| Date | Status | Borrower | Loan Amount |
|---|---|---|---|
| Previous Owner | Valencia Olga L | $12,000 | |
| Previous Owner | Valencia Olga L | $225,000 | |
| Previous Owner | Valencia Olga L | $10,000 |
Source: Public Records
Tax History
| Year | Tax Paid | Tax Assessment Tax Assessment Total Assessment is a certain percentage of the fair market value that is determined by local assessors to be the total taxable value of land and additions on the property. | Land | Improvement |
|---|---|---|---|---|
| 2025 | $7,626 | $664,300 | $198,700 | $465,600 |
| 2024 | $6,967 | $585,000 | $173,300 | $411,700 |
| 2023 | $6,386 | $514,200 | $144,000 | $370,200 |
| 2022 | $5,911 | $465,800 | $130,900 | $334,900 |
| 2021 | $5,482 | $407,300 | $113,900 | $293,400 |
| 2020 | $5,037 | $377,000 | $106,400 | $270,600 |
| 2019 | $4,682 | $333,500 | $98,600 | $234,900 |
| 2018 | $4,380 | $304,400 | $93,900 | $210,500 |
| 2017 | $4,142 | $277,600 | $85,400 | $192,200 |
| 2016 | $4,013 | $264,700 | $71,500 | $193,200 |
| 2015 | $3,745 | $241,900 | $73,200 | $168,700 |
| 2013 | $3,502 | $233,300 | $90,300 | $143,000 |
Source: Public Records
Map
Nearby Homes
- 53 Bodwell Ave
- 45 Bodwell Ave
- 172 Emery Ave
- 156 Gershom Ave
- 60 Bodwell Ave
- 159 Gershom Ave
- 255 White St
- 37 Bodwell Ave
- 160 Emery Ave
- 182 Emery Ave
- 259 White St
- 152 Gershom Ave
- 245 White St
- 151-153 Gershom Ave Unit 151
- 151 Gershom Ave
- 241 White St
- 273 White St
- 31 Bodwell Ave
- 149 Gershom Ave
- 36 Bodwell Ave
Your Personal Tour Guide
Ask me questions while you tour the home.