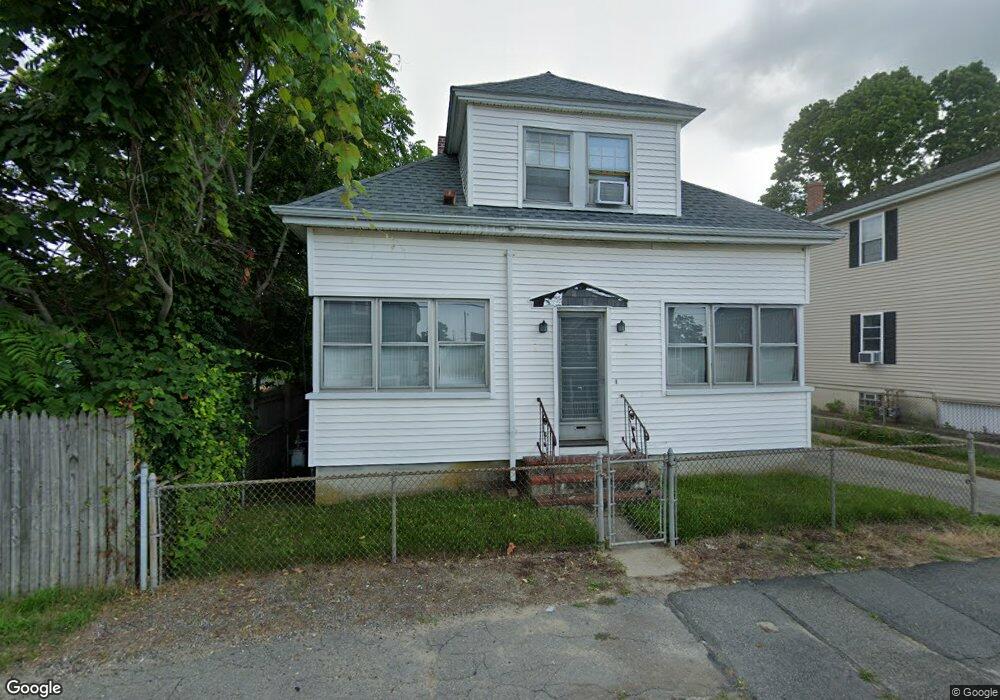
61 Slocum St Acushnet, MA 02743
Estimated Value: $336,550 - $446,000
2
Beds
1
Bath
1,328
Sq Ft
$301/Sq Ft
Est. Value
About This Home
This home is located at 61 Slocum St, Acushnet, MA 02743 and is currently estimated at $400,138, approximately $301 per square foot. 61 Slocum St is a home located in Bristol County with nearby schools including Acushnet Elementary School, Albert F Ford Middle School, and Alma Del Mar Charter School.
Ownership History
Date
Name
Owned For
Owner Type
Purchase Details
Closed on
Dec 18, 1992
Sold by
Tucker Mary Anne and Blaise Jill
Bought by
Abreu Michael A and Abreu Eleanor M
Current Estimated Value
Home Financials for this Owner
Home Financials are based on the most recent Mortgage that was taken out on this home.
Original Mortgage
$90,300
Interest Rate
8.3%
Mortgage Type
Purchase Money Mortgage
Purchase Details
Closed on
May 29, 1990
Sold by
Est Laiscell Doris L C
Bought by
Tucker Mary Anne
Home Financials for this Owner
Home Financials are based on the most recent Mortgage that was taken out on this home.
Original Mortgage
$89,000
Interest Rate
10.13%
Mortgage Type
Purchase Money Mortgage
Create a Home Valuation Report for This Property
The Home Valuation Report is an in-depth analysis detailing your home's value as well as a comparison with similar homes in the area
Home Values in the Area
Average Home Value in this Area
Purchase History
We collect this data history from publicly available records. To have your information removed, we recommend requesting removal directly through your county’s website.
| Date | Buyer | Sale Price | Title Company |
|---|---|---|---|
| Abreu Michael A | $91,000 | -- | |
| Tucker Mary Anne | $94,000 | -- | |
| Tucker Mary Anne | $94,000 | -- |
Source: Public Records
Mortgage History
We collect this data history from publicly available records. To have your information removed, we recommend requesting removal directly through your county’s website.
| Date | Status | Borrower | Loan Amount |
|---|---|---|---|
| Closed | Tucker Mary Anne | $90,300 | |
| Previous Owner | Tucker Mary Anne | $89,000 |
Source: Public Records
Tax History
| Year | Tax Paid | Tax Assessment Tax Assessment Total Assessment is a certain percentage of the fair market value that is determined by local assessors to be the total taxable value of land and additions on the property. | Land | Improvement |
|---|---|---|---|---|
| 2025 | $32 | $300,400 | $87,600 | $212,800 |
| 2024 | $3,148 | $275,900 | $83,500 | $192,400 |
| 2023 | $2,966 | $247,200 | $75,400 | $171,800 |
| 2022 | $2,896 | $218,200 | $71,300 | $146,900 |
| 2021 | $2,712 | $196,100 | $71,300 | $124,800 |
| 2020 | $2,734 | $196,100 | $71,300 | $124,800 |
| 2019 | $2,818 | $175,300 | $63,200 | $112,100 |
| 2018 | $2,671 | $175,300 | $63,200 | $112,100 |
| 2017 | $2,381 | $164,900 | $63,200 | $101,700 |
| 2016 | $2,397 | $165,000 | $63,200 | $101,800 |
| 2015 | $2,263 | $158,500 | $63,200 | $95,300 |
Source: Public Records
Map
Nearby Homes
Your Personal Tour Guide
Ask me questions while you tour the home.