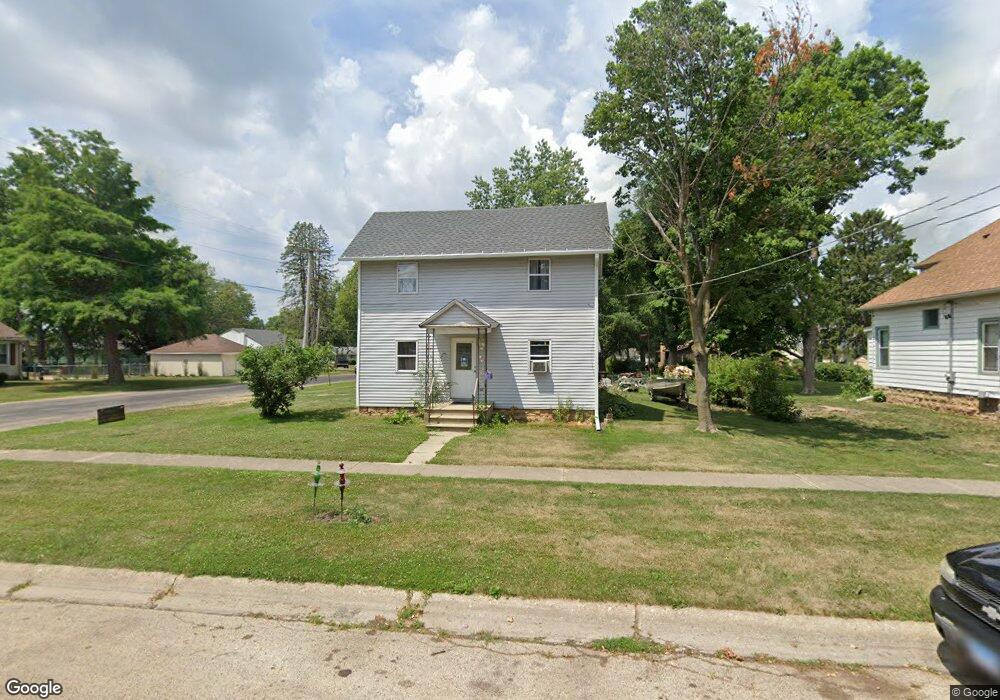
610 S 5th St Oregon, IL 61061
Estimated Value: $121,000 - $152,000
3
Beds
2
Baths
1,520
Sq Ft
$93/Sq Ft
Est. Value
About This Home
This home is located at 610 S 5th St, Oregon, IL 61061 and is currently estimated at $141,672, approximately $93 per square foot. 610 S 5th St is a home located in Ogle County with nearby schools including Oregon Elementary School and Oregon High School.
Ownership History
Date
Name
Owned For
Owner Type
Purchase Details
Closed on
Sep 27, 2006
Sold by
Nitram Properties Inc
Bought by
Custer Mark D
Current Estimated Value
Home Financials for this Owner
Home Financials are based on the most recent Mortgage that was taken out on this home.
Original Mortgage
$112,244
Outstanding Balance
$67,089
Interest Rate
6.49%
Mortgage Type
New Conventional
Estimated Equity
$74,583
Purchase Details
Closed on
Feb 24, 2006
Sold by
Preston Robert J
Bought by
Nitram Properties Inc
Home Financials for this Owner
Home Financials are based on the most recent Mortgage that was taken out on this home.
Original Mortgage
$80,000
Interest Rate
6.2%
Mortgage Type
Purchase Money Mortgage
Create a Home Valuation Report for This Property
The Home Valuation Report is an in-depth analysis detailing your home's value as well as a comparison with similar homes in the area
Home Values in the Area
Average Home Value in this Area
Purchase History
| Date | Buyer | Sale Price | Title Company |
|---|---|---|---|
| Custer Mark D | $102,000 | None Available | |
| Nitram Properties Inc | $80,657 | None Available | |
| Preston Robert J | -- | None Available |
Source: Public Records
Mortgage History
| Date | Status | Borrower | Loan Amount |
|---|---|---|---|
| Open | Custer Mark D | $112,244 | |
| Previous Owner | Nitram Properties Inc | $80,000 |
Source: Public Records
Tax History
| Year | Tax Paid | Tax Assessment Tax Assessment Total Assessment is a certain percentage of the fair market value that is determined by local assessors to be the total taxable value of land and additions on the property. | Land | Improvement |
|---|---|---|---|---|
| 2024 | $2,817 | $38,756 | $6,509 | $32,247 |
| 2023 | $2,928 | $35,375 | $6,502 | $28,873 |
| 2022 | $2,757 | $32,742 | $6,018 | $26,724 |
| 2021 | $2,559 | $30,551 | $5,615 | $24,936 |
| 2020 | $2,449 | $29,196 | $5,366 | $23,830 |
| 2019 | $2,421 | $29,050 | $5,339 | $23,711 |
| 2018 | $2,273 | $27,799 | $5,109 | $22,690 |
| 2017 | $2,264 | $27,799 | $5,109 | $22,690 |
| 2016 | $2,143 | $26,825 | $4,930 | $21,895 |
| 2015 | $2,131 | $27,770 | $5,104 | $22,666 |
| 2014 | $2,168 | $27,770 | $5,104 | $22,666 |
| 2013 | $2,173 | $29,152 | $5,358 | $23,794 |
Source: Public Records
Map
Nearby Homes
Your Personal Tour Guide
Ask me questions while you tour the home.