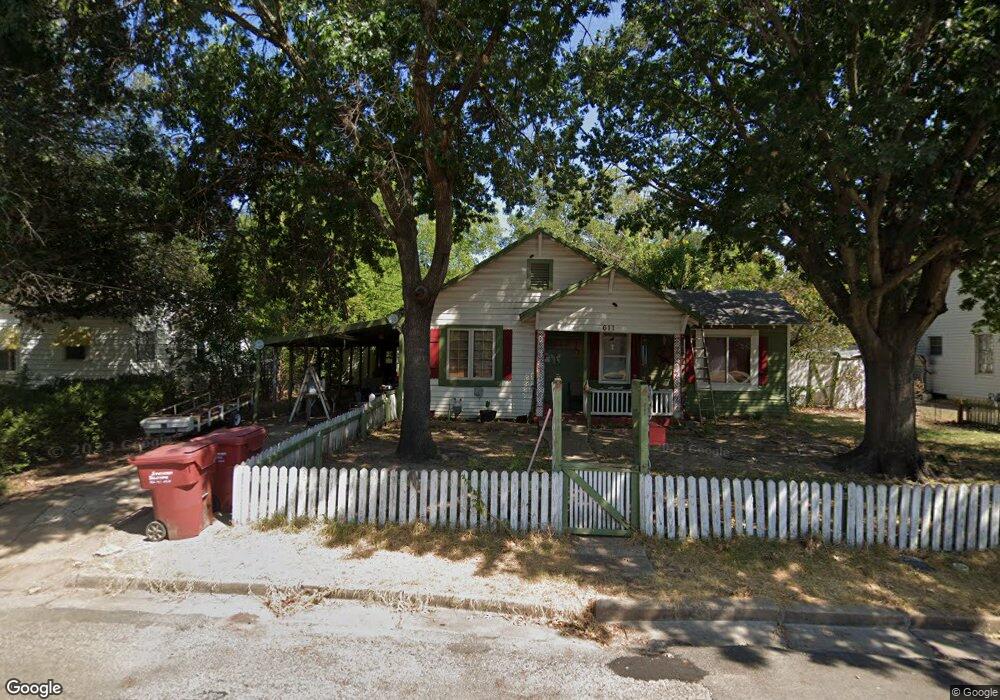
611 E 12th St Bonham, TX 75418
Estimated Value: $120,124 - $151,000
2
Beds
1
Bath
1,028
Sq Ft
$134/Sq Ft
Est. Value
About This Home
This home is located at 611 E 12th St, Bonham, TX 75418 and is currently estimated at $138,031, approximately $134 per square foot. 611 E 12th St is a home located in Fannin County with nearby schools including Evans Elementary School, Finley-Oates Elementary School, and LH Rather Jr High School.
Ownership History
Date
Name
Owned For
Owner Type
Purchase Details
Closed on
Jun 29, 2009
Sold by
Wood Joseph B
Bought by
Stevenes Scotty W and Stevenes Dennise Renay
Current Estimated Value
Home Financials for this Owner
Home Financials are based on the most recent Mortgage that was taken out on this home.
Original Mortgage
$24,000
Outstanding Balance
$15,156
Interest Rate
4.84%
Estimated Equity
$122,875
Create a Home Valuation Report for This Property
The Home Valuation Report is an in-depth analysis detailing your home's value as well as a comparison with similar homes in the area
Purchase History
| Date | Buyer | Sale Price | Title Company |
|---|---|---|---|
| Stevenes Scotty W | -- | None Available |
Source: Public Records
Mortgage History
| Date | Status | Borrower | Loan Amount |
|---|---|---|---|
| Open | Stevenes Scotty W | $24,000 |
Source: Public Records
Tax History
| Year | Tax Paid | Tax Assessment Tax Assessment Total Assessment is a certain percentage of the fair market value that is determined by local assessors to be the total taxable value of land and additions on the property. | Land | Improvement |
|---|---|---|---|---|
| 2025 | $1,258 | $121,210 | $45,460 | $75,750 |
| 2024 | $549 | $117,510 | $43,500 | $74,010 |
| 2023 | $1,057 | $115,800 | $41,110 | $74,690 |
| 2022 | $1,071 | $103,150 | $28,930 | $74,220 |
| 2021 | $1,119 | $70,050 | $13,810 | $56,240 |
| 2020 | $1,029 | $63,390 | $10,880 | $52,510 |
| 2019 | $973 | $64,550 | $9,790 | $54,760 |
| 2018 | $883 | $39,630 | $9,570 | $30,060 |
| 2017 | $773 | $31,170 | $4,890 | $26,280 |
| 2016 | $703 | $27,500 | $4,890 | $22,610 |
| 2015 | -- | $25,830 | $4,680 | $21,150 |
| 2014 | -- | $24,750 | $3,790 | $20,960 |
Source: Public Records
Map
Nearby Homes
- 1204 Park Ave
- 1320 Elm St
- 501 E 15th St
- 907 E 10th St
- 803 E 14th St
- 708 Seven Oaks Rd Unit 712
- 215 E 12th St
- 617 E 9th St
- 302 E 10th St
- 304 E 9th St
- 814 Chestnut St
- 1604 N Center St
- 903 Lynn St
- 103 E 15th St
- 809 E 7th St
- 815 Seven Oaks Rd
- 0000 S State Highway 78
- 45.62 Acres S State Highway 78
- 611 Chestnut St
- 1007 Willow St
Your Personal Tour Guide
Ask me questions while you tour the home.