612 Fairmount St Woonsocket, RI 02895
Fairmount NeighborhoodEstimated Value: $337,000 - $367,000
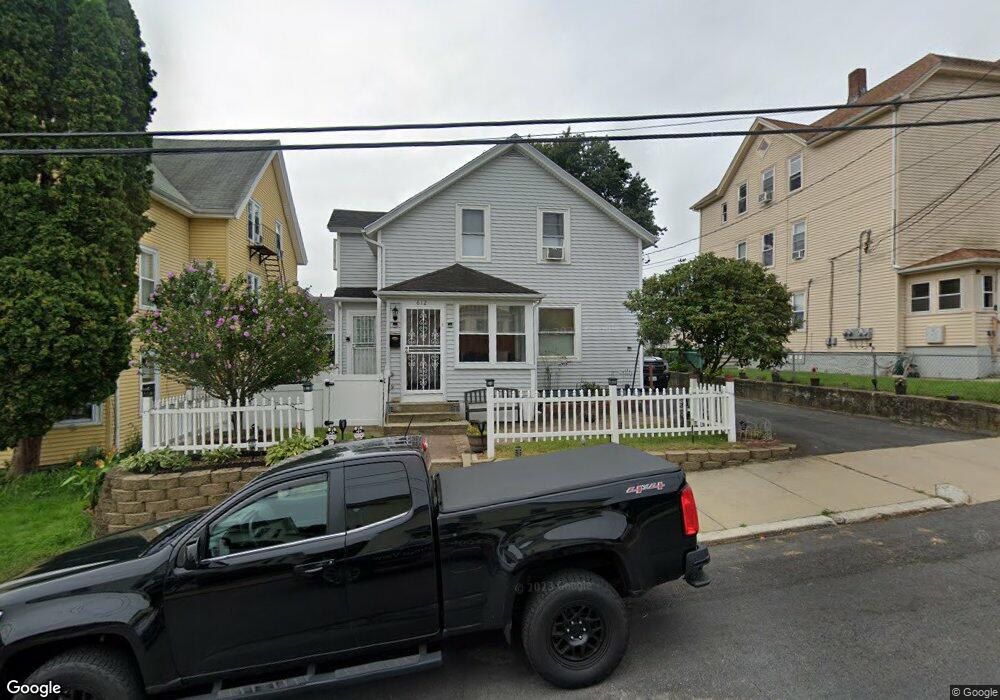
About This Home
This home is located at 612 Fairmount St, Woonsocket, RI 02895 and is currently estimated at $354,477, approximately $321 per square foot. 612 Fairmount St is a home located in Providence County with nearby schools including Woonsocket High School, Rise Prep Mayoral Academy Middle School, and Rise Prep Mayoral Academy.
Ownership History
We collect this data history from publicly available records. To have your information removed, we recommend requesting removal directly through your county’s website.
Purchase Details
Purchase Details
Home Values in the Area
Average Home Value in this Area
Purchase History
We collect this data history from publicly available records. To have your information removed, we recommend requesting removal directly through your county’s website.
| Date | Buyer | Sale Price | Title Company |
|---|---|---|---|
| -- | -- | ||
| -- | -- | ||
| $58,080 | -- | ||
| $58,080 | -- |
Mortgage History
We collect this data history from publicly available records. To have your information removed, we recommend requesting removal directly through your county’s website.
| Date | Status | Borrower | Loan Amount |
|---|---|---|---|
| Previous Owner | $167,995 | ||
| Previous Owner | $135,256 |
Tax History
We collect this data history from publicly available records. To have your information removed, we recommend requesting removal directly through your county’s website.
| Year | Tax Paid | Tax Assessment Tax Assessment Total Assessment is a certain percentage of the fair market value that is determined by local assessors to be the total taxable value of land and additions on the property. | Land | Improvement |
|---|---|---|---|---|
| 2025 | $3,581 | $318,900 | $87,900 | $231,000 |
| 2024 | $3,638 | $250,200 | $89,500 | $160,700 |
| 2023 | $3,498 | $250,200 | $89,500 | $160,700 |
| 2022 | $3,498 | $250,200 | $89,500 | $160,700 |
| 2021 | $3,140 | $132,200 | $35,600 | $96,600 |
| 2020 | $3,173 | $132,200 | $35,600 | $96,600 |
| 2018 | $3,183 | $132,200 | $35,600 | $96,600 |
| 2017 | $3,440 | $114,300 | $40,000 | $74,300 |
| 2016 | $3,639 | $114,300 | $40,000 | $74,300 |
| 2015 | $4,181 | $114,300 | $40,000 | $74,300 |
| 2014 | $3,968 | $110,400 | $44,000 | $66,400 |
Map
- 601 Fairmount St
- 607 Fairmount St
- 581 Fairmount St
- 228 7th Ave
- 183 8th Ave
- 573 Fairmount St
- 600 Fairmount St
- 221 7th Ave
- 197 8th Ave
- 629 Fairmount St
- 620 Fairmount St
- 576 Fairmount St
- 576 Fairmount St Unit 2
- 565 Fairmount St
- 231 7th Ave
- 207 8th Ave
- 0 8th Ave
- 630 Fairmount St
- 158 7th Ave
- 564 Fairmount St
Ask me questions while you tour the home.