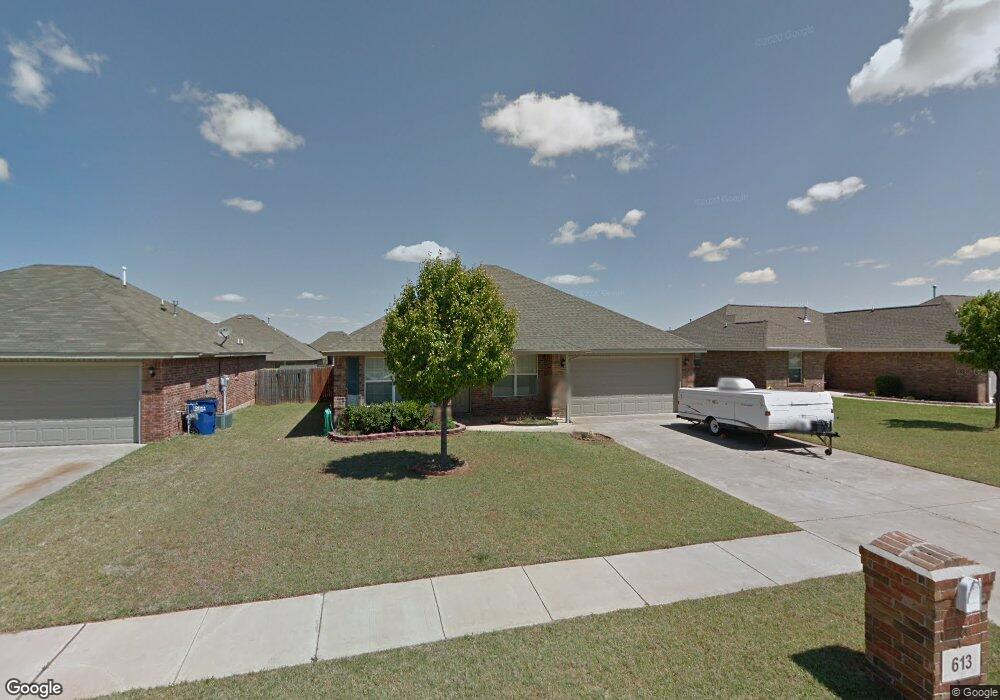
613 E Juniper Ln Mustang, OK 73064
Estimated Value: $207,000 - $218,051
3
Beds
2
Baths
1,406
Sq Ft
$153/Sq Ft
Est. Value
About This Home
This home is located at 613 E Juniper Ln, Mustang, OK 73064 and is currently estimated at $215,013, approximately $152 per square foot. 613 E Juniper Ln is a home located in Canadian County with nearby schools including Mustang Elementary School, Mustang Horizon Intermediate School, and Mustang Middle School.
Ownership History
Date
Name
Owned For
Owner Type
Purchase Details
Closed on
Dec 28, 2017
Sold by
Jobish Joy Jobish and Jobish Joy Jinu
Bought by
Magnus Investments Llc
Current Estimated Value
Purchase Details
Closed on
Apr 26, 2017
Sold by
Wilimington Savings Fund Society
Bought by
Joy Jobish and Mathai Jobin
Home Financials for this Owner
Home Financials are based on the most recent Mortgage that was taken out on this home.
Original Mortgage
$102,400
Interest Rate
3.97%
Mortgage Type
New Conventional
Purchase Details
Closed on
Oct 18, 2016
Sold by
Hague Karman
Bought by
Wilmington Savings Fund Society Fsb and Christiana Trust
Purchase Details
Closed on
May 8, 2009
Sold by
Rausch Coleman Homes Okc Llc
Bought by
Hague Karman
Home Financials for this Owner
Home Financials are based on the most recent Mortgage that was taken out on this home.
Original Mortgage
$131,572
Interest Rate
4.84%
Mortgage Type
FHA
Create a Home Valuation Report for This Property
The Home Valuation Report is an in-depth analysis detailing your home's value as well as a comparison with similar homes in the area
Home Values in the Area
Average Home Value in this Area
Purchase History
We collect this data history from publicly available records. To have your information removed, we recommend requesting removal directly through your county’s website.
| Date | Buyer | Sale Price | Title Company |
|---|---|---|---|
| Magnus Investments Llc | -- | First American Title | |
| Joy Jobish | $128,000 | American Eagle Title Group | |
| Wilmington Savings Fund Society Fsb | $122,401 | None Available | |
| Hague Karman | $134,500 | Wta |
Source: Public Records
Mortgage History
We collect this data history from publicly available records. To have your information removed, we recommend requesting removal directly through your county’s website.
| Date | Status | Borrower | Loan Amount |
|---|---|---|---|
| Previous Owner | Joy Jobish | $102,400 | |
| Previous Owner | Hague Karman | $131,572 |
Source: Public Records
Tax History
| Year | Tax Paid | Tax Assessment Tax Assessment Total Assessment is a certain percentage of the fair market value that is determined by local assessors to be the total taxable value of land and additions on the property. | Land | Improvement |
|---|---|---|---|---|
| 2025 | $2,087 | $21,518 | $3,000 | $18,518 |
| 2024 | $1,947 | $20,493 | $3,000 | $17,493 |
| 2023 | $1,947 | $19,517 | $3,000 | $16,517 |
| 2022 | $1,877 | $18,588 | $3,000 | $15,588 |
| 2021 | $1,795 | $17,703 | $3,000 | $14,703 |
| 2020 | $1,743 | $17,088 | $3,000 | $14,088 |
| 2019 | $1,716 | $16,819 | $3,000 | $13,819 |
| 2018 | $1,670 | $16,018 | $3,000 | $13,018 |
| 2017 | $1,665 | $16,160 | $3,000 | $13,160 |
| 2016 | $1,688 | $16,351 | $3,000 | $13,351 |
| 2015 | -- | $15,931 | $3,000 | $12,931 |
| 2014 | -- | $15,467 | $3,180 | $12,287 |
Source: Public Records
Map
Nearby Homes
- 605 E Greenwood Ln
- 512 S Castle Ridge Ln
- 544 E Forest Ln
- 605 E Linden Ln
- 1025 S Colt Ln
- 527 E Linden Ln
- 629 E Elder Ln
- 924 S Meadow Ln
- 516 S Brookview Ln
- 122 N Montebella Terrace
- 232 E Abbot Ln
- 228 E Abbot Ln
- 224 E Abbot Ln
- 225 E Abbot Ln
- 220 E Abbot Ln
- 221 E Abbot Ln
- 229 E Juniper Ln
- 217 E Abbot Ln
- 213 E Abbot Ln
- 204 E Abbot Ln
- 621 E Hillcrest Ln
- 621 E Hillcrest Ln
- 617 E Hillcrest Ln
- 625 E Hillcrest Ln
- 629 E Hillcrest Ln
- 613 E Hillcrest Ln
- 616 E Greenwood Ln
- 612 E Greenwood Ln
- 620 E Greenwood Ln
- 616 E Hillcrest Ln
- 624 E Greenwood Ln
- 620 E Hillcrest Ln
- 633 E Hillcrest Ln
- 609 E Hillcrest Ln
- 608 E Greenwood Ln
- 612 E Hillcrest Ln
- 624 E Hillcrest Ln
- 608 E Hillcrest Ln
- 605 E Hillcrest Ln
- 605 E Hillcrest Ln
Your Personal Tour Guide
Ask me questions while you tour the home.