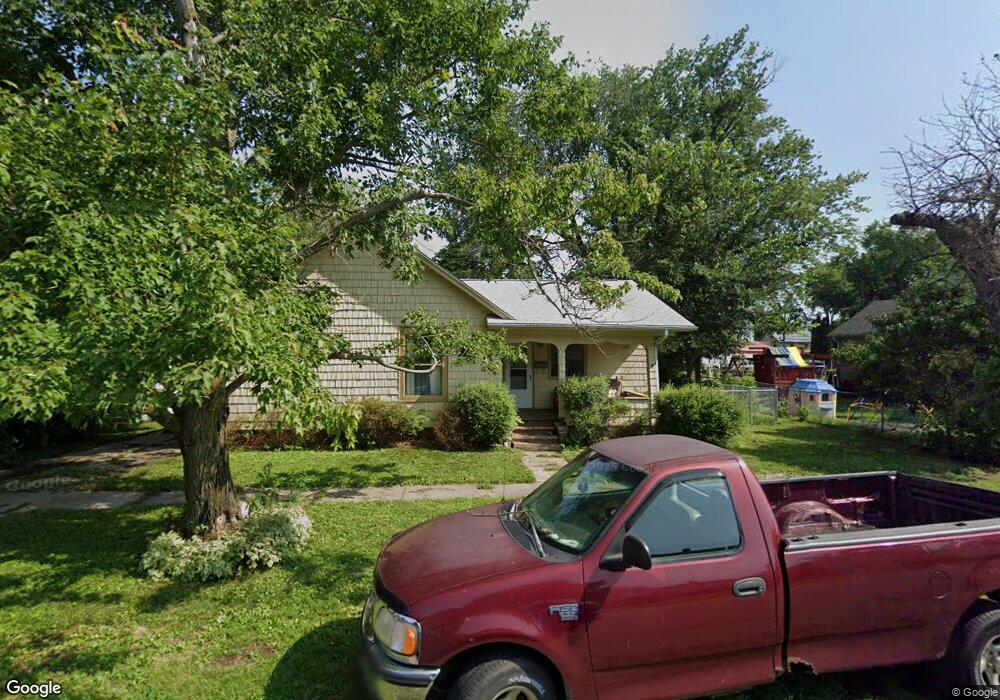
614 E 5th Ave Monmouth, IL 61462
Estimated Value: $67,000 - $72,000
3
Beds
1
Bath
--
Sq Ft
6,186
Sq Ft Lot
About This Home
This home is located at 614 E 5th Ave, Monmouth, IL 61462 and is currently estimated at $70,546. 614 E 5th Ave is a home located in Warren County with nearby schools including Lincoln Early Childhood School, Central Intermediate School, and Harding Primary School.
Ownership History
Date
Name
Owned For
Owner Type
Purchase Details
Closed on
Sep 10, 2024
Sold by
Varnold Christina J
Bought by
John Mackenzie and Cervantez Lauren
Current Estimated Value
Home Financials for this Owner
Home Financials are based on the most recent Mortgage that was taken out on this home.
Original Mortgage
$61,890
Outstanding Balance
$61,182
Interest Rate
6.38%
Mortgage Type
New Conventional
Estimated Equity
$9,364
Purchase Details
Closed on
Oct 1, 2021
Sold by
Pinson Leonard
Bought by
E June Pinson Living Trust
Home Financials for this Owner
Home Financials are based on the most recent Mortgage that was taken out on this home.
Original Mortgage
$42,650
Interest Rate
2.8%
Mortgage Type
New Conventional
Purchase Details
Closed on
Jan 3, 2019
Sold by
Pinson E June
Bought by
Pinson E June
Purchase Details
Closed on
Nov 12, 2018
Sold by
Pinson E June
Bought by
Pinson E June
Create a Home Valuation Report for This Property
The Home Valuation Report is an in-depth analysis detailing your home's value as well as a comparison with similar homes in the area
Home Values in the Area
Average Home Value in this Area
Purchase History
| Date | Buyer | Sale Price | Title Company |
|---|---|---|---|
| John Mackenzie | $68,000 | Western Illinois Title | |
| E June Pinson Living Trust | $44,000 | Western Illinois Title | |
| Pinson E June | -- | None Available | |
| Pinson E June | -- | None Available |
Source: Public Records
Mortgage History
| Date | Status | Borrower | Loan Amount |
|---|---|---|---|
| Open | John Mackenzie | $61,890 | |
| Previous Owner | E June Pinson Living Trust | $42,650 |
Source: Public Records
Tax History
| Year | Tax Paid | Tax Assessment Tax Assessment Total Assessment is a certain percentage of the fair market value that is determined by local assessors to be the total taxable value of land and additions on the property. | Land | Improvement |
|---|---|---|---|---|
| 2024 | $1,051 | $16,450 | $1,750 | $14,700 |
| 2023 | $1,051 | $15,420 | $1,640 | $13,780 |
| 2022 | $895 | $14,730 | $1,570 | $13,160 |
| 2021 | $2,005 | $18,760 | $1,470 | $17,290 |
| 2020 | $800 | $18,760 | $1,470 | $17,290 |
| 2019 | $742 | $18,270 | $1,430 | $16,840 |
| 2018 | $371 | $3,630 | $1,410 | $2,220 |
| 2017 | $365 | $17,970 | $1,400 | $16,570 |
| 2016 | $350 | $17,970 | $1,400 | $16,570 |
| 2015 | -- | $17,550 | $1,370 | $16,180 |
| 2014 | -- | $17,130 | $1,340 | $15,790 |
| 2013 | -- | $16,370 | $1,280 | $15,090 |
Source: Public Records
Map
Nearby Homes
Your Personal Tour Guide
Ask me questions while you tour the home.