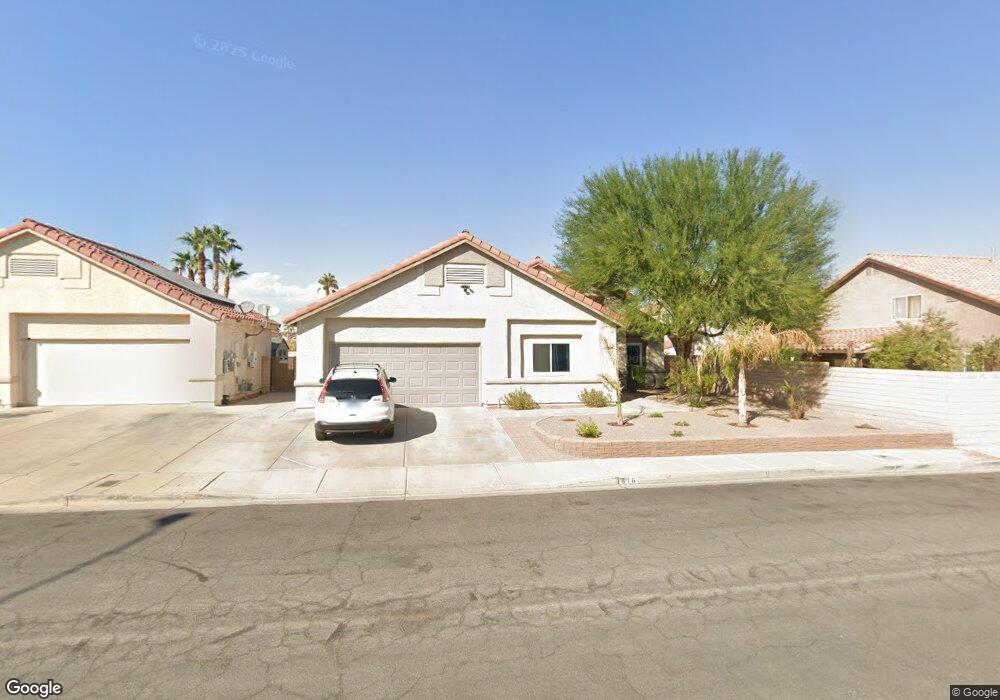
616 Hitchen Post Dr Henderson, NV 89011
South Valley Ranch NeighborhoodEstimated Value: $463,000 - $477,180
4
Beds
2
Baths
2,033
Sq Ft
$232/Sq Ft
Est. Value
About This Home
This home is located at 616 Hitchen Post Dr, Henderson, NV 89011 and is currently estimated at $472,045, approximately $232 per square foot. 616 Hitchen Post Dr is a home located in Clark County with nearby schools including Josh Stevens Elementary School, Francis H Cortney Junior High School, and Basic Academy of International Studies.
Ownership History
Date
Name
Owned For
Owner Type
Purchase Details
Closed on
Feb 9, 2017
Sold by
Conant Dawn
Bought by
Beza Megan E
Current Estimated Value
Purchase Details
Closed on
Oct 23, 2012
Sold by
Beza Megan E
Bought by
Conant Dawn
Purchase Details
Closed on
Aug 13, 2005
Sold by
Beza Megan E and Vaughn Megan E
Bought by
Beza John M and Beza Megan E
Home Financials for this Owner
Home Financials are based on the most recent Mortgage that was taken out on this home.
Original Mortgage
$261,654
Interest Rate
6.91%
Mortgage Type
New Conventional
Purchase Details
Closed on
Jul 11, 2003
Sold by
Wiley Jeff M
Bought by
Vaughn Megan E
Home Financials for this Owner
Home Financials are based on the most recent Mortgage that was taken out on this home.
Original Mortgage
$165,600
Interest Rate
5.29%
Mortgage Type
Balloon
Purchase Details
Closed on
Mar 19, 1998
Sold by
Family Classics Ltd Partnership
Bought by
Wiley Jeff M and Wiley Sharon M
Home Financials for this Owner
Home Financials are based on the most recent Mortgage that was taken out on this home.
Original Mortgage
$123,364
Interest Rate
7.06%
Mortgage Type
FHA
Create a Home Valuation Report for This Property
The Home Valuation Report is an in-depth analysis detailing your home's value as well as a comparison with similar homes in the area
Home Values in the Area
Average Home Value in this Area
Purchase History
| Date | Buyer | Sale Price | Title Company |
|---|---|---|---|
| Beza Megan E | $223,837 | None Available | |
| Conant Dawn | $134,500 | Ticor Title Las Vegas | |
| Beza John M | -- | Chicago Title | |
| Vaughn Megan E | $207,000 | Nevada Title Company | |
| Wiley Jeff M | $129,500 | Nevada Title Company |
Source: Public Records
Mortgage History
| Date | Status | Borrower | Loan Amount |
|---|---|---|---|
| Previous Owner | Beza John M | $261,654 | |
| Previous Owner | Vaughn Megan E | $165,600 | |
| Previous Owner | Wiley Jeff M | $123,364 | |
| Closed | Vaughn Megan E | $31,050 |
Source: Public Records
Tax History
| Year | Tax Paid | Tax Assessment Tax Assessment Total Assessment is a certain percentage of the fair market value that is determined by local assessors to be the total taxable value of land and additions on the property. | Land | Improvement |
|---|---|---|---|---|
| 2026 | $1,836 | $113,854 | $32,900 | $80,954 |
| 2025 | $1,782 | $114,217 | $31,150 | $83,067 |
| 2024 | $1,731 | $114,217 | $31,150 | $83,067 |
| 2023 | $1,731 | $107,963 | $29,400 | $78,563 |
| 2022 | $1,635 | $97,018 | $24,850 | $72,168 |
| 2021 | $1,589 | $90,434 | $21,700 | $68,734 |
| 2020 | $1,539 | $90,022 | $21,700 | $68,322 |
| 2019 | $1,522 | $86,080 | $18,900 | $67,180 |
| 2018 | $1,451 | $80,181 | $15,400 | $64,781 |
| 2017 | $2,271 | $78,343 | $12,600 | $65,743 |
| 2016 | $1,396 | $72,929 | $9,800 | $63,129 |
| 2015 | $1,393 | $56,781 | $8,050 | $48,731 |
| 2014 | $1,352 | $45,276 | $6,125 | $39,151 |
Source: Public Records
Map
Nearby Homes
- 1072 Deep Well Ct
- 624 Black Sand Ct
- 1013 Adobe Flat Dr
- 563 Scarlet Crest Ave Unit Lot 1140
- 1019 Copper Robin St
- 717 Moonlight Mesa Dr
- 1017 Copper Robin St
- 1015 Copper Robin St
- 1013 Copper Robin St
- 1009 Copper Robin St
- 1078 Peacock Plume St
- 560 Silver Falcon Ave
- 1084 Peacock Plume St
- 1086 Peacock Plume St
- 1005 Copper Robin St
- 1082 Peacock Plume St
- 1095 Soft Swan Ave
- 1001 Copper Robin St Unit 735
- 1099 Soft Swan Ave
- 733 Hitchen Post Dr
- 620 Hitchen Post Dr
- 1057 Split Rail St
- 1061 Split Rail St
- 1064 Little House Ct
- 628 Hitchen Post Dr
- 1065 Split Rail St
- 613 Hitchen Post Dr
- 1068 Little House Ct
- 617 Hitchen Post Dr
- 621 Hitchen Post Dr
- 609 Hitchen Post Dr
- 1069 Split Rail St
- 625 Hitchen Post Dr
- 1072 Little House Ct
- 1056 Split Rail St
- 1069 Little House Ct
- 605 Hitchen Post Dr
- 1060 Split Rail St Unit DI
- 1052 Split Rail St
- 629 Hitchen Post Dr
Your Personal Tour Guide
Ask me questions while you tour the home.