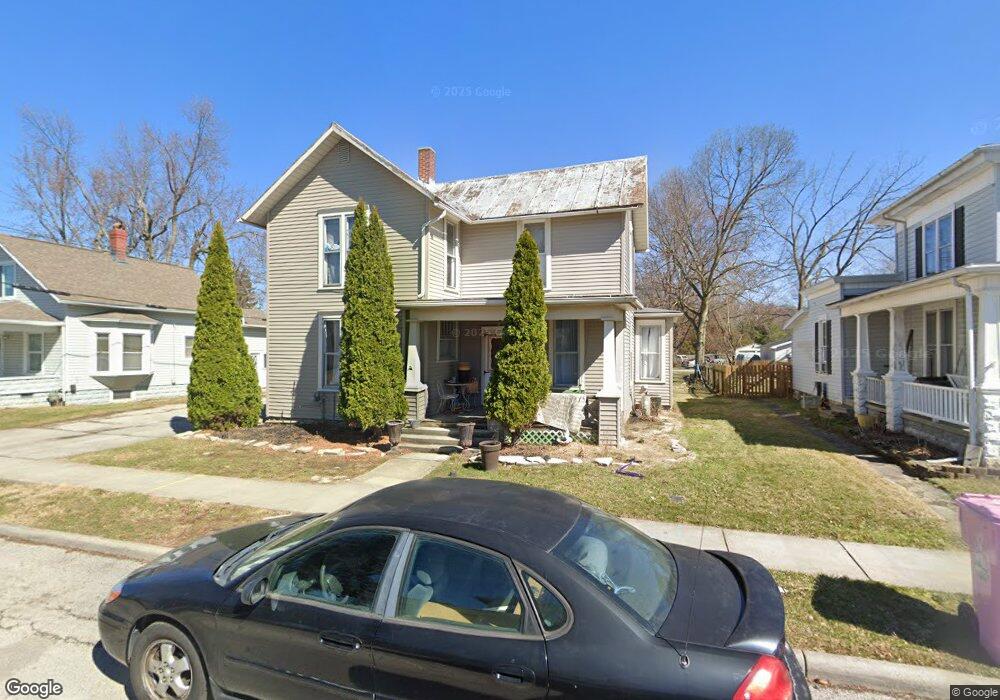
619 Morse St Findlay, OH 45840
Estimated Value: $185,195 - $228,000
4
Beds
2
Baths
2,158
Sq Ft
$97/Sq Ft
Est. Value
About This Home
This home is located at 619 Morse St, Findlay, OH 45840 and is currently estimated at $209,049, approximately $96 per square foot. 619 Morse St is a home located in Hancock County with nearby schools including Whittier Elementary School, Wilson Vance Elementary School, and Donnell Middle School.
Ownership History
Date
Name
Owned For
Owner Type
Purchase Details
Closed on
Jun 28, 2022
Sold by
Adan Vasquez
Bought by
Mares Priscilla
Current Estimated Value
Purchase Details
Closed on
Nov 14, 2016
Sold by
Keuren Traci L Van and Keuren James K Van
Bought by
Vasquez Adan and Mares Priscilla
Purchase Details
Closed on
May 26, 2010
Sold by
Fannie Mae
Bought by
Vankeuren Traci L and Van Keuren James K
Purchase Details
Closed on
Mar 31, 2010
Sold by
Shrider Stanley E
Bought by
Federal National Mortgage Association
Purchase Details
Closed on
Nov 1, 1985
Bought by
Shrider Stanley E and Shrider Maria
Create a Home Valuation Report for This Property
The Home Valuation Report is an in-depth analysis detailing your home's value as well as a comparison with similar homes in the area
Home Values in the Area
Average Home Value in this Area
Purchase History
We collect this data history from publicly available records. To have your information removed, we recommend requesting removal directly through your county’s website.
| Date | Buyer | Sale Price | Title Company |
|---|---|---|---|
| Mares Priscilla | -- | None Listed On Document | |
| Vasquez Adan | $72,500 | Flag City Title Agency Inc | |
| Vankeuren Traci L | $32,000 | Mid Am Title Agency | |
| Federal National Mortgage Association | $26,000 | None Available | |
| Shrider Stanley E | $45,000 | -- |
Source: Public Records
Tax History
| Year | Tax Paid | Tax Assessment Tax Assessment Total Assessment is a certain percentage of the fair market value that is determined by local assessors to be the total taxable value of land and additions on the property. | Land | Improvement |
|---|---|---|---|---|
| 2025 | $1,726 | $56,300 | $7,220 | $49,080 |
| 2024 | $1,576 | $44,350 | $5,680 | $38,670 |
| 2023 | $1,578 | $44,350 | $5,680 | $38,670 |
| 2022 | $1,572 | $44,350 | $5,680 | $38,670 |
| 2021 | $1,355 | $33,280 | $5,670 | $27,610 |
| 2020 | $1,354 | $33,280 | $5,670 | $27,610 |
| 2019 | $1,327 | $33,280 | $5,670 | $27,610 |
| 2018 | $1,161 | $26,660 | $5,160 | $21,500 |
| 2017 | $632 | $26,660 | $5,160 | $21,500 |
| 2016 | $1,183 | $26,660 | $5,160 | $21,500 |
| 2015 | $1,033 | $22,960 | $3,450 | $19,510 |
| 2014 | $1,033 | $22,960 | $3,450 | $19,510 |
| 2012 | $1,026 | $22,590 | $3,450 | $19,140 |
Source: Public Records
Map
Nearby Homes
Your Personal Tour Guide
Ask me questions while you tour the home.