619 Morse St Findlay, OH 45840
Findlay AreaEstimated Value: $200,010 - $217,000
About This Home
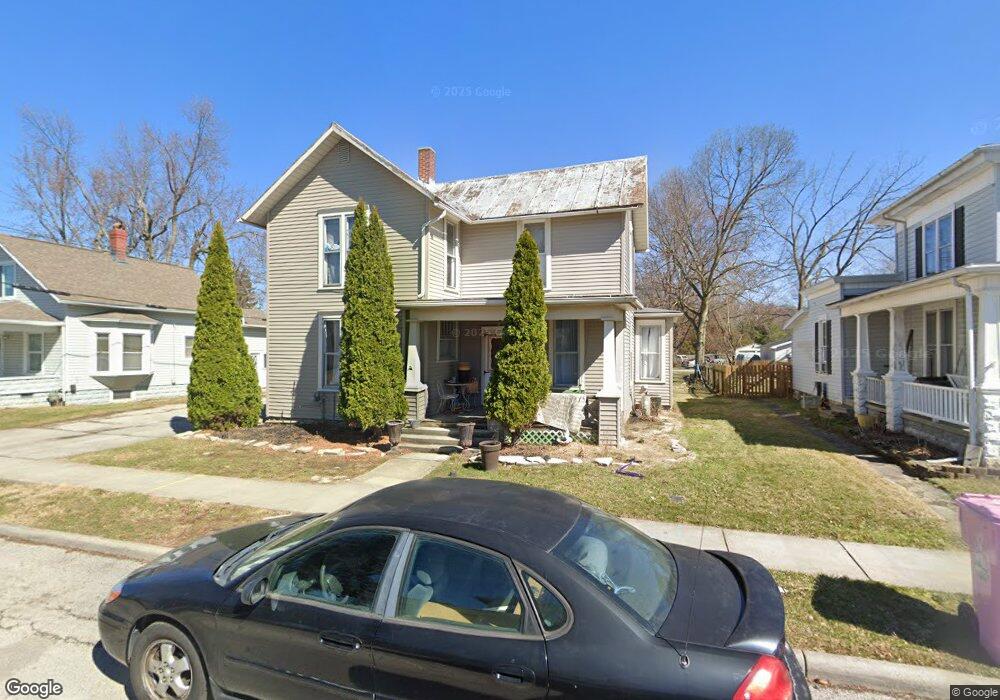
This home is located at 619 Morse St, Findlay, OH 45840 and is currently estimated at $209,003, approximately $96 per square foot. 619 Morse St is a home located in Hancock County with nearby schools including Whittier Elementary School, Wilson Vance Elementary School, and Donnell Middle School.
Ownership History
We collect this data history from publicly available records. To have your information removed, we recommend requesting removal directly through your county’s website.
Purchase Details
Home Financials for this Owner
Home Financials are based on the most recent Mortgage that was taken out on this home.Purchase Details
Purchase Details
Purchase Details
Purchase Details
Home Values in the Area
Average Home Value in this Area
Purchase History
We collect this data history from publicly available records. To have your information removed, we recommend requesting removal directly through your county’s website.
| Date | Buyer | Sale Price | Title Company |
|---|---|---|---|
| -- | None Listed On Document | ||
| $72,500 | Flag City Title Agency Inc | ||
| $32,000 | Mid Am Title Agency | ||
| $26,000 | None Available | ||
| $45,000 | -- |
Mortgage History
We collect this data history from publicly available records. To have your information removed, we recommend requesting removal directly through your county’s website.
| Date | Status | Borrower | Loan Amount |
|---|---|---|---|
| Open | $97,000 | ||
| Previous Owner | $50,000 |
Tax History
We collect this data history from publicly available records. To have your information removed, we recommend requesting removal directly through your county’s website.
| Year | Tax Paid | Tax Assessment Tax Assessment Total Assessment is a certain percentage of the fair market value that is determined by local assessors to be the total taxable value of land and additions on the property. | Land | Improvement |
|---|---|---|---|---|
| 2025 | $1,726 | $56,300 | $7,220 | $49,080 |
| 2024 | $1,576 | $44,350 | $5,680 | $38,670 |
| 2023 | $1,578 | $44,350 | $5,680 | $38,670 |
| 2022 | $1,572 | $44,350 | $5,680 | $38,670 |
| 2021 | $1,355 | $33,280 | $5,670 | $27,610 |
| 2020 | $1,354 | $33,280 | $5,670 | $27,610 |
| 2019 | $1,327 | $33,280 | $5,670 | $27,610 |
| 2018 | $1,161 | $26,660 | $5,160 | $21,500 |
| 2017 | $632 | $26,660 | $5,160 | $21,500 |
| 2016 | $1,183 | $26,660 | $5,160 | $21,500 |
| 2015 | $1,033 | $22,960 | $3,450 | $19,510 |
| 2014 | $1,033 | $22,960 | $3,450 | $19,510 |
| 2012 | $1,026 | $22,590 | $3,450 | $19,140 |
Map
- 15586 Canadian Way
- 1210 South St
- 314 & 316 E Hardin St
- 930 Robinhood Ave
- 300 Mohican Rd
- 317 Mohican Rd
- 643 Center St
- 923 Washington Ave
- 1125 S Blanchard St
- 1105 1st St
- 680 Colt Dr
- 420 2nd St
- 814 Beech Ave
- 853 Beech Ave
- 1229 Leiser Ave
- 835 S Main St
- 943 Breezewood Ct
- 1119 Washington Ave
- 505 Flintlock Ct
- 439 Carnahan Ave
Ask me questions while you tour the home.