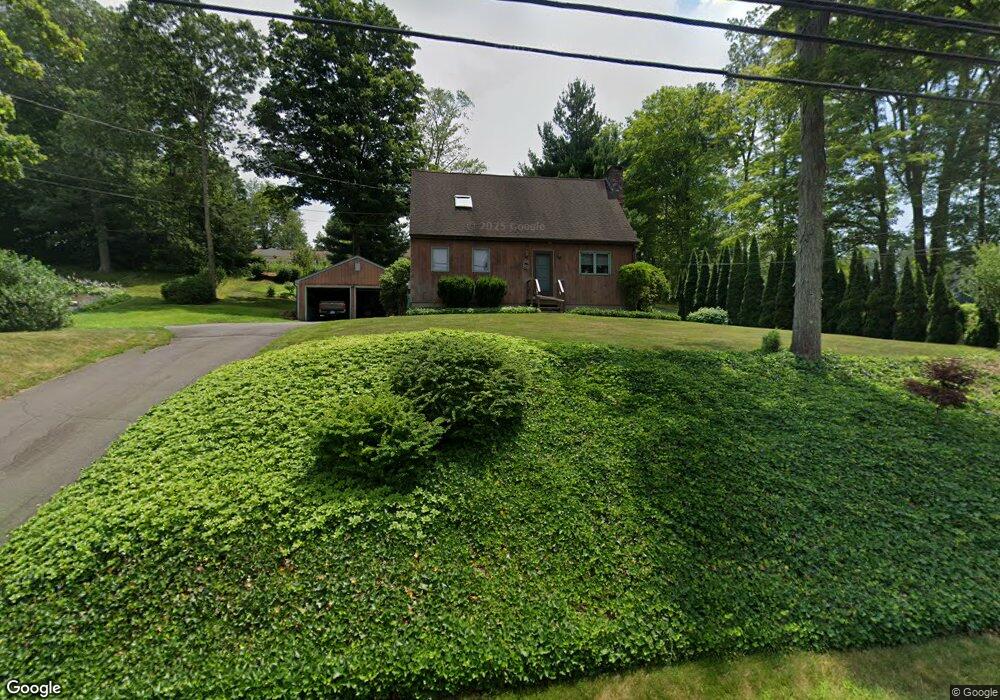
619 N Elm St Wallingford, CT 06492
Estimated Value: $406,376 - $506,000
3
Beds
2
Baths
1,227
Sq Ft
$367/Sq Ft
Est. Value
About This Home
This home is located at 619 N Elm St, Wallingford, CT 06492 and is currently estimated at $450,094, approximately $366 per square foot. 619 N Elm St is a home located in New Haven County with nearby schools including Moses Y Beach Elementary School, Rock Hill Elementary School, and Dag Hammarskjold Middle School.
Ownership History
Date
Name
Owned For
Owner Type
Purchase Details
Closed on
Oct 29, 1993
Sold by
Liszewski John and Liszewski Teresa K
Bought by
Mace Gerald M
Current Estimated Value
Home Financials for this Owner
Home Financials are based on the most recent Mortgage that was taken out on this home.
Original Mortgage
$110,000
Interest Rate
6.86%
Mortgage Type
Unknown
Create a Home Valuation Report for This Property
The Home Valuation Report is an in-depth analysis detailing your home's value as well as a comparison with similar homes in the area
Home Values in the Area
Average Home Value in this Area
Purchase History
We collect this data history from publicly available records. To have your information removed, we recommend requesting removal directly through your county’s website.
| Date | Buyer | Sale Price | Title Company |
|---|---|---|---|
| Mace Gerald M | $155,000 | -- | |
| Mace Gerald M | $155,000 | -- |
Source: Public Records
Mortgage History
We collect this data history from publicly available records. To have your information removed, we recommend requesting removal directly through your county’s website.
| Date | Status | Borrower | Loan Amount |
|---|---|---|---|
| Closed | Mace Gerald M | $40,000 | |
| Closed | Mace Gerald M | $110,000 | |
| Previous Owner | Mace Gerald M | $13,000 |
Source: Public Records
Tax History
| Year | Tax Paid | Tax Assessment Tax Assessment Total Assessment is a certain percentage of the fair market value that is determined by local assessors to be the total taxable value of land and additions on the property. | Land | Improvement |
|---|---|---|---|---|
| 2025 | $6,254 | $259,300 | $106,300 | $153,000 |
| 2024 | $5,813 | $189,600 | $88,600 | $101,000 |
| 2023 | $5,563 | $189,600 | $88,600 | $101,000 |
| 2022 | $5,506 | $189,600 | $88,600 | $101,000 |
| 2021 | $5,407 | $189,600 | $88,600 | $101,000 |
| 2020 | $5,482 | $187,800 | $88,400 | $99,400 |
| 2019 | $5,482 | $187,800 | $88,400 | $99,400 |
| 2018 | $5,379 | $187,800 | $88,400 | $99,400 |
| 2017 | $5,362 | $187,800 | $88,400 | $99,400 |
| 2016 | $5,238 | $187,800 | $88,400 | $99,400 |
| 2015 | $5,318 | $193,600 | $88,400 | $105,200 |
| 2014 | $5,206 | $193,600 | $88,400 | $105,200 |
Source: Public Records
Map
Nearby Homes
- 44 Farm Hill Rd
- 12 Briarwood Ln
- 26 Seiter Hill Rd
- 26 Beechwood Dr
- 5 Dell Ct
- 349 E Main St
- 58 Grieb Rd
- 776 N Farms Rd
- 36 3rd St
- 4 Poppy Ln
- 108 N Whittlesey Ave
- 940 Durham Rd
- 1095 Durham Rd
- 6 Sterling Village Unit 6
- 85 N Colony St
- 230 Main St Unit LOT 4A
- 230 Main St Unit 18
- 326 Grieb Rd
- 976 Old Rock Hill Rd
- 17 Kingsland Ave
Your Personal Tour Guide
Ask me questions while you tour the home.