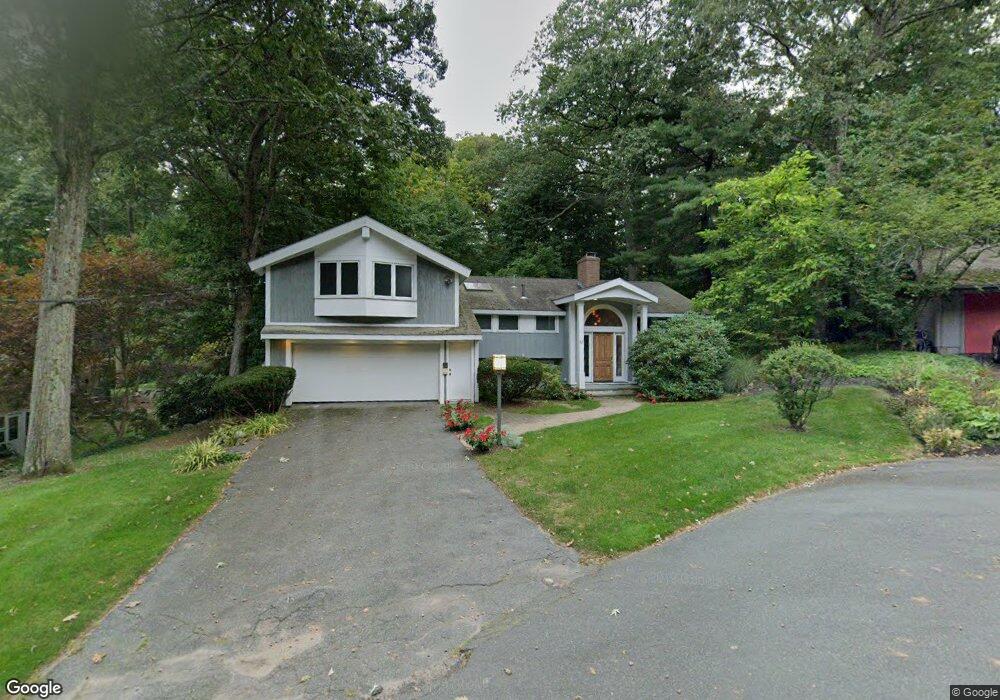
62 Newcomb Rd Stoneham, MA 02180
Haywardville NeighborhoodEstimated Value: $996,000 - $1,069,002
About This Home
This home is located at 62 Newcomb Rd, Stoneham, MA 02180 and is currently estimated at $1,037,501, approximately $411 per square foot. 62 Newcomb Rd is a home located in Middlesex County with nearby schools including Stoneham High School, Melrose Montessori School, and St Mary's School.
Ownership History
We collect this data history from publicly available records. To have your information removed, we recommend requesting removal directly through your county’s website.
Purchase Details
Home Financials for this Owner
Home Financials are based on the most recent Mortgage that was taken out on this home.Home Values in the Area
Average Home Value in this Area
Purchase History
We collect this data history from publicly available records. To have your information removed, we recommend requesting removal directly through your county’s website.
| Date | Buyer | Sale Price | Title Company |
|---|---|---|---|
| $197,500 | -- |
Mortgage History
We collect this data history from publicly available records. To have your information removed, we recommend requesting removal directly through your county’s website.
| Date | Status | Borrower | Loan Amount |
|---|---|---|---|
| Open | $200,000 | ||
| Closed | $187,600 |
Tax History
We collect this data history from publicly available records. To have your information removed, we recommend requesting removal directly through your county’s website.
| Year | Tax Paid | Tax Assessment Tax Assessment Total Assessment is a certain percentage of the fair market value that is determined by local assessors to be the total taxable value of land and additions on the property. | Land | Improvement |
|---|---|---|---|---|
| 2025 | $8,501 | $831,000 | $440,100 | $390,900 |
| 2024 | $8,053 | $760,400 | $400,100 | $360,300 |
| 2023 | $7,908 | $712,400 | $360,100 | $352,300 |
| 2022 | $6,977 | $670,200 | $340,100 | $330,100 |
| 2021 | $7,031 | $649,800 | $330,100 | $319,700 |
| 2020 | $6,924 | $641,700 | $320,100 | $321,600 |
| 2019 | $6,953 | $619,700 | $320,100 | $299,600 |
| 2018 | $13,838 | $588,400 | $300,100 | $288,300 |
| 2017 | $6,609 | $533,400 | $290,100 | $243,300 |
| 2016 | $6,346 | $499,700 | $280,100 | $219,600 |
| 2015 | $6,133 | $473,200 | $260,100 | $213,100 |
| 2014 | $6,321 | $468,600 | $260,100 | $208,500 |
Map
- 76 Perkins St
- 27 Citation Ave
- 45 Maple Rd
- 410 Fellsview Terrace Unit 415
- 46 Windsor Rd
- 200 Park Terrace Dr Unit 245
- 219 Lynn Fells Pkwy Unit 3
- 9 Mendum St
- 3 Franklin Terrace
- 79 Baxter St
- 60 Vinton St Unit 3
- 33 Brunswick Park Unit 2
- 1 Ravine Terrace Unit 1
- 32 Sanford St
- 601 Franklin St Unit 2
- 18-20 N High St
- 7 W Ferdinand St
- 185 Essex St Unit 1A
- 47 S High St
- 159 Franklin St Unit E6
Ask me questions while you tour the home.