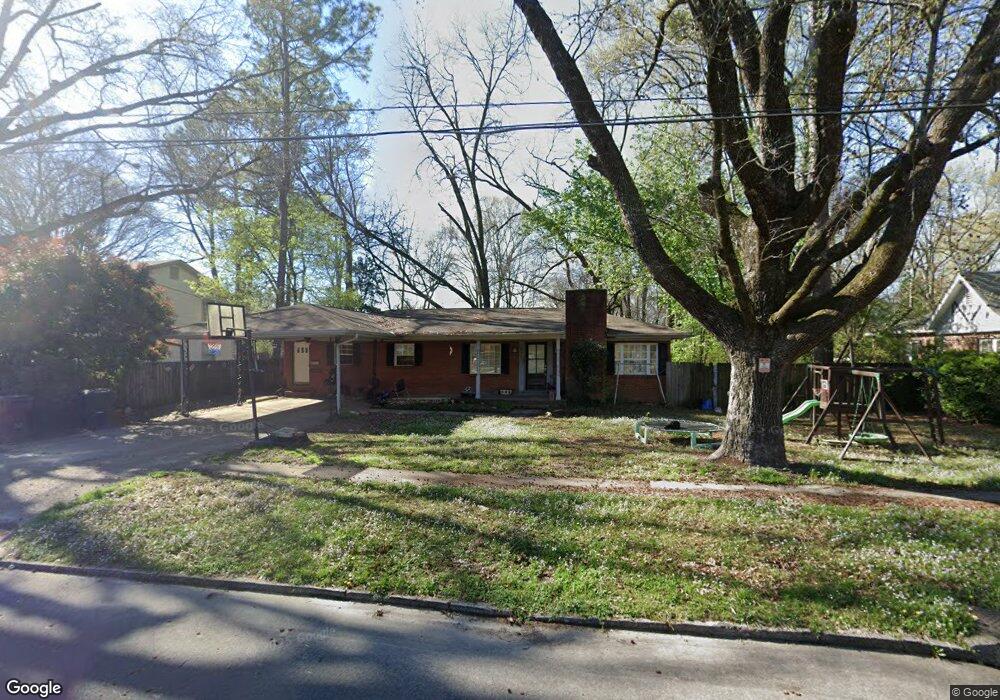
621 Allen St Tupelo, MI 38804
Historic Downtown Tupelo NeighborhoodEstimated Value: $169,000 - $292,000
3
Beds
4
Baths
2,525
Sq Ft
$87/Sq Ft
Est. Value
About This Home
This home is located at 621 Allen St, Tupelo, MI 38804 and is currently estimated at $220,278, approximately $87 per square foot. 621 Allen St is a home located in Lee County with nearby schools including Carver Elementary School, Lawhon Elementary School, and Milam Elementary School.
Ownership History
Date
Name
Owned For
Owner Type
Purchase Details
Closed on
Apr 5, 2013
Sold by
Logan Properties Llc
Bought by
Gammel Michael J
Current Estimated Value
Home Financials for this Owner
Home Financials are based on the most recent Mortgage that was taken out on this home.
Original Mortgage
$97,206
Outstanding Balance
$68,534
Interest Rate
3.52%
Estimated Equity
$151,745
Create a Home Valuation Report for This Property
The Home Valuation Report is an in-depth analysis detailing your home's value as well as a comparison with similar homes in the area
Home Values in the Area
Average Home Value in this Area
Purchase History
We collect this data history from publicly available records. To have your information removed, we recommend requesting removal directly through your county’s website.
| Date | Buyer | Sale Price | Title Company |
|---|---|---|---|
| Gammel Michael J | -- | -- |
Source: Public Records
Mortgage History
We collect this data history from publicly available records. To have your information removed, we recommend requesting removal directly through your county’s website.
| Date | Status | Borrower | Loan Amount |
|---|---|---|---|
| Open | Gammel Michael J | $97,206 |
Source: Public Records
Tax History
| Year | Tax Paid | Tax Assessment Tax Assessment Total Assessment is a certain percentage of the fair market value that is determined by local assessors to be the total taxable value of land and additions on the property. | Land | Improvement |
|---|---|---|---|---|
| 2025 | $1,948 | $14,330 | $0 | $0 |
| 2024 | $1,948 | $14,330 | $0 | $0 |
| 2023 | $1,014 | $9,641 | $0 | $0 |
| 2022 | $1,936 | $14,462 | $0 | $0 |
| 2021 | $1,936 | $14,462 | $0 | $0 |
| 2020 | $1,936 | $14,462 | $0 | $0 |
| 2019 | $1,869 | $13,964 | $0 | $0 |
| 2018 | $1,869 | $13,964 | $0 | $0 |
| 2017 | $1,862 | $13,964 | $0 | $0 |
| 2016 | $1,862 | $13,964 | $0 | $0 |
| 2015 | $1,538 | $11,580 | $0 | $0 |
| 2014 | $1,538 | $11,580 | $0 | $0 |
Source: Public Records
Map
Nearby Homes
- 468 N Church St
- 512 Magnolia Dr
- 414 N Broadway St
- 703 N Madison St
- 0 N Spring St
- 608 N Spring St
- 623 N Gloster St
- 0 Hwy 45
- 0 Cr 747 Unit 26-1097
- 619 Clayton Ave
- 273 S Green St
- 1110 W Jackson St
- 410 Elliott St
- 1125 Chapman Dr
- 298 S Green St
- 306 S Green St
- 123 S Industrial Rd
- 1128 W Jackson St
- 803 Clayton Ave
- 512 S Broadway St
Your Personal Tour Guide
Ask me questions while you tour the home.