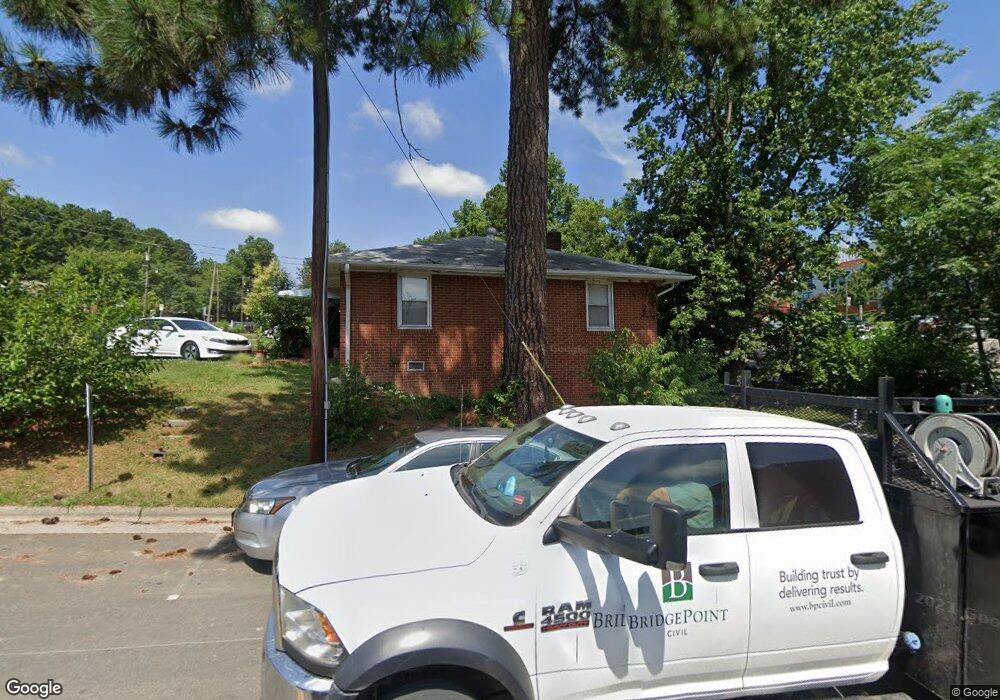
621 Cecil St Durham, NC 27707
Estimated Value: $212,496 - $277,000
About This Home
This home is located at 621 Cecil St, Durham, NC 27707 and is currently estimated at $248,374, approximately $260 per square foot. 621 Cecil St is a home located in Durham County with nearby schools including Fayetteville Street Elementary School, James E. Shepard Middle School, and Hillside High School.
Ownership History
We collect this data history from publicly available records. To have your information removed, we recommend requesting removal directly through your county’s website.
Purchase Details
Home Financials for this Owner
Home Financials are based on the most recent Mortgage that was taken out on this home.Purchase Details
Purchase History
We collect this data history from publicly available records. To have your information removed, we recommend requesting removal directly through your county’s website.
| Date | Buyer | Sale Price | Title Company |
|---|---|---|---|
| $65,000 | None Available | ||
| $62,840 | -- |
Mortgage History
We collect this data history from publicly available records. To have your information removed, we recommend requesting removal directly through your county’s website.
| Date | Status | Borrower | Loan Amount |
|---|---|---|---|
| Open | $52,000 |
Tax History
We collect this data history from publicly available records. To have your information removed, we recommend requesting removal directly through your county’s website.
| Year | Tax Paid | Tax Assessment Tax Assessment Total Assessment is a certain percentage of the fair market value that is determined by local assessors to be the total taxable value of land and additions on the property. | Land | Improvement |
|---|---|---|---|---|
| 2025 | $2,028 | $204,621 | $96,250 | $108,371 |
| 2024 | $1,518 | $108,831 | $24,795 | $84,036 |
| 2023 | $1,426 | $108,831 | $24,795 | $84,036 |
| 2022 | $1,393 | $108,831 | $24,795 | $84,036 |
| 2021 | $1,386 | $108,831 | $24,795 | $84,036 |
| 2020 | $1,354 | $108,943 | $24,907 | $84,036 |
| 2019 | $1,355 | $108,943 | $24,907 | $84,036 |
| 2018 | $958 | $70,620 | $16,605 | $54,015 |
| 2017 | $951 | $70,620 | $16,605 | $54,015 |
| 2016 | $919 | $70,620 | $16,605 | $54,015 |
| 2015 | $876 | $63,253 | $11,208 | $52,045 |
| 2014 | $876 | $63,253 | $11,208 | $52,045 |
Map
- 605 Cecil St
- 615 Hope Ave
- 1411 Rosewood St
- 2414 Chapin St
- 1306 Rosewood St
- 1708 Athens Ave
- 1911 Gilmore Ave
- 2220 Fitzgerald Ave
- 203 Nelson St
- 803 B Dupree St
- 809 Dupree St
- 2216 Chautauqua Ave
- 2201 Otis St
- 1212 Truman St
- 2617 Fayetteville St
- 1817 S Alston Ave
- 417 Dupree St
- 906 Price Ave
- 1608 Fayetteville St
- 1811 Pritchard Place
Ask me questions while you tour the home.