Estimated Value: $509,000 - $562,000
About This Home
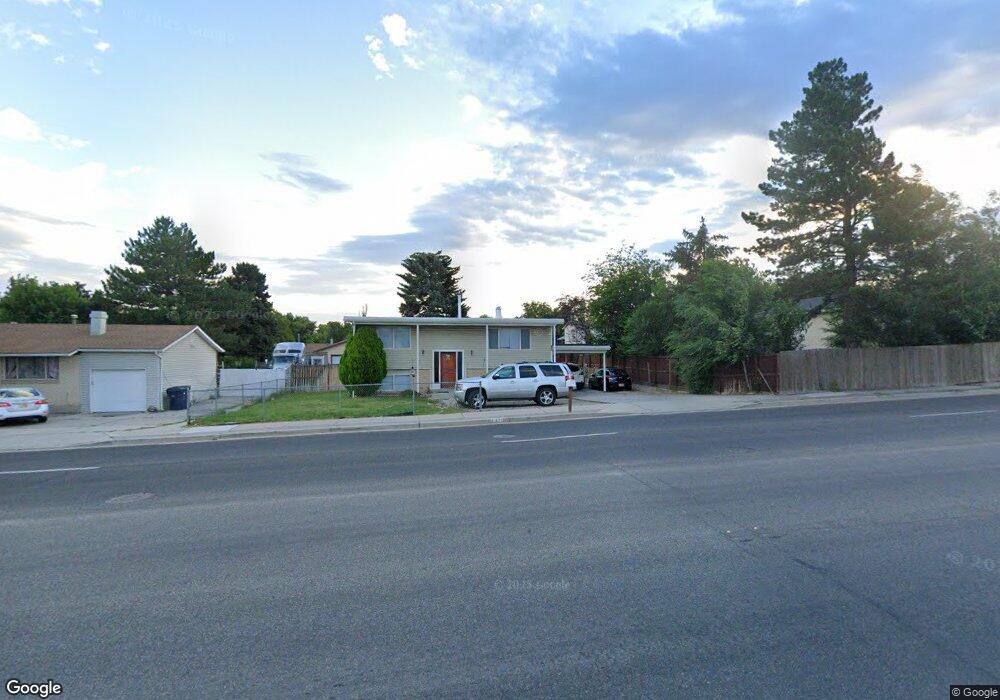
This home is located at 621 E 10600 S, Sandy, UT 84070 and is currently estimated at $523,523, approximately $302 per square foot. 621 E 10600 S is a home located in Salt Lake County with nearby schools including Alta View Elementary School, Jordan High, and Mount Jordan Middle School.
Ownership History
We collect this data history from publicly available records. To have your information removed, we recommend requesting removal directly through your county’s website.
Purchase Details
Purchase Details
Home Financials for this Owner
Home Financials are based on the most recent Mortgage that was taken out on this home.Purchase Details
Home Financials for this Owner
Home Financials are based on the most recent Mortgage that was taken out on this home.Home Values in the Area
Average Home Value in this Area
Purchase History
We collect this data history from publicly available records. To have your information removed, we recommend requesting removal directly through your county’s website.
| Date | Buyer | Sale Price | Title Company |
|---|---|---|---|
| -- | Kyle H Barrick | ||
| -- | First American Title | ||
| -- | -- |
Mortgage History
We collect this data history from publicly available records. To have your information removed, we recommend requesting removal directly through your county’s website.
| Date | Status | Borrower | Loan Amount |
|---|---|---|---|
| Previous Owner | $166,920 | ||
| Previous Owner | $74,000 |
Tax History
We collect this data history from publicly available records. To have your information removed, we recommend requesting removal directly through your county’s website.
| Year | Tax Paid | Tax Assessment Tax Assessment Total Assessment is a certain percentage of the fair market value that is determined by local assessors to be the total taxable value of land and additions on the property. | Land | Improvement |
|---|---|---|---|---|
| 2025 | $2,697 | $429,200 | $106,100 | $323,100 |
| 2024 | $2,571 | $410,900 | $101,200 | $309,700 |
| 2023 | $2,394 | $385,600 | $96,200 | $289,400 |
| 2022 | $2,493 | $395,200 | $94,300 | $300,900 |
| 2021 | $2,249 | $298,300 | $73,000 | $225,300 |
| 2020 | $2,156 | $267,900 | $73,000 | $194,900 |
| 2019 | $2,113 | $255,200 | $68,900 | $186,300 |
| 2018 | $1,880 | $231,600 | $68,900 | $162,700 |
| 2017 | $1,876 | $220,600 | $68,900 | $151,700 |
| 2016 | $1,870 | $213,100 | $68,900 | $144,200 |
| 2015 | $1,800 | $187,600 | $66,800 | $120,800 |
| 2014 | $1,740 | $179,900 | $64,800 | $115,100 |
Map
- 627 E Hilo St
- 710 E Sandy Point Dr
- 717 Sand Dollar Dr
- 476 E 10425 S
- 558 E Cherry Plum Ct
- 748 Silver Sage Dr
- 373 E 10450 S
- 361 E 10450 S
- 10705 S 300 E
- 10351 S Zinnia Way
- 286 E Sandy Sage Way
- 877 E 10600 S
- 680 E Family Cir
- 10574 S Crocus St
- 10637 S Crescent Bend Dr
- 10251 S 535 E
- 10422 S Beetdigger Blvd
- 432 Calnette Dr
- 218 Golden Willow Cir
- 10743 S 930 E
Ask me questions while you tour the home.