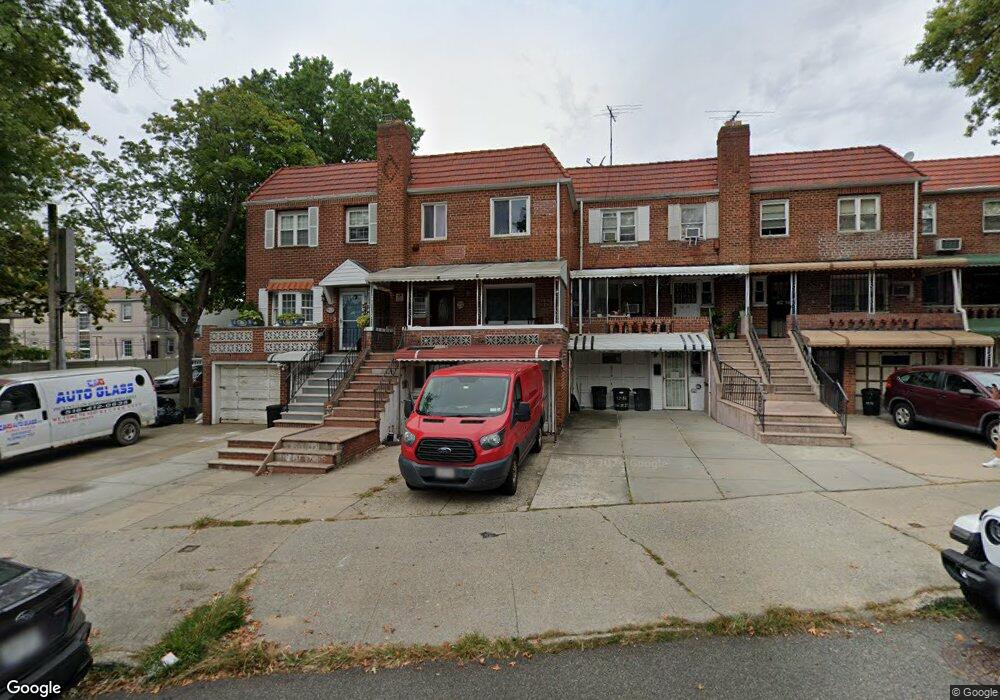
6218 Main St Flushing, NY 11367
Queensboro Hill NeighborhoodEstimated Value: $1,010,315 - $1,319,000
About This Home
This home is located at 6218 Main St, Flushing, NY 11367 and is currently estimated at $1,178,079, approximately $603 per square foot. 6218 Main St is a home located in Queens County with nearby schools including P.S. 219 - Paul Klapper, I.S. 250 - The Robert F. Kennedy Community Middle School, and John Bowne High School.
Ownership History
We collect this data history from publicly available records. To have your information removed, we recommend requesting removal directly through your county’s website.
Purchase Details
Home Financials for this Owner
Home Financials are based on the most recent Mortgage that was taken out on this home.Home Values in the Area
Average Home Value in this Area
Purchase History
We collect this data history from publicly available records. To have your information removed, we recommend requesting removal directly through your county’s website.
| Date | Buyer | Sale Price | Title Company |
|---|---|---|---|
| -- | -- |
Mortgage History
We collect this data history from publicly available records. To have your information removed, we recommend requesting removal directly through your county’s website.
| Date | Status | Borrower | Loan Amount |
|---|---|---|---|
| Previous Owner | $224,000 |
Tax History
We collect this data history from publicly available records. To have your information removed, we recommend requesting removal directly through your county’s website.
| Year | Tax Paid | Tax Assessment Tax Assessment Total Assessment is a certain percentage of the fair market value that is determined by local assessors to be the total taxable value of land and additions on the property. | Land | Improvement |
|---|---|---|---|---|
| 2026 | $8,000 | $43,723 | $6,521 | $37,202 |
| 2025 | $7,535 | $41,249 | $6,179 | $35,070 |
| 2024 | $7,547 | $38,916 | $6,536 | $32,380 |
| 2023 | $7,315 | $37,822 | $5,912 | $31,910 |
| 2022 | $7,263 | $56,280 | $10,560 | $45,720 |
| 2021 | $7,372 | $55,980 | $10,560 | $45,420 |
| 2020 | $6,980 | $61,500 | $10,560 | $50,940 |
| 2019 | $6,491 | $62,580 | $10,560 | $52,020 |
| 2018 | $6,127 | $31,518 | $5,914 | $25,604 |
| 2017 | $6,125 | $31,518 | $6,443 | $25,075 |
| 2016 | $5,760 | $31,518 | $6,443 | $25,075 |
| 2015 | $3,366 | $28,645 | $8,149 | $20,496 |
| 2014 | $3,366 | $27,025 | $8,408 | $18,617 |
Map
- 13835 64th Ave
- 63-01 138th St
- 63-09 138th St
- 13817 64th Ave
- 13814 58th Rd
- 5804 Main St Unit 2D
- 148-10 59th Ave
- 136-43 58th Rd
- 6152 149th St
- 146-24 58th Ave
- 5831 136th St
- 5844 136th St
- 136-49 58th Ave
- 13631 58th Ave
- 15001 Reeves Ave
- 150-07 Reeves Ave
- 13437 58th Rd
- 64-22 136th St
- 150-12 59th Ave
- 14849 58th Rd
- 61-18 Main St Unit 2Fl
- 61-20 Main St
- 61-20 Main St Unit 2nd Fl
- 61-10 Main St
- 6122 Main St
- 6124 Main St
- 6120 Main St
- 6118 Main St
- 61-16 Main St
- 61-16 Main St Unit 2 Fl
- 61-16 Main St Unit 1 Fl
- 6126 Main St
- 6116 Main St
- 6128 Main St
- 61-28 Main St
- 6130 Main St
- 6130 Main St
- 6112 Main St
- 61-00 Main St
- 14204 Horace Harding Expy
Ask me questions while you tour the home.