6225 Mori St McLean, VA 22101
McLean AreaEstimated Value: $2,084,000 - $2,541,000
About This Home
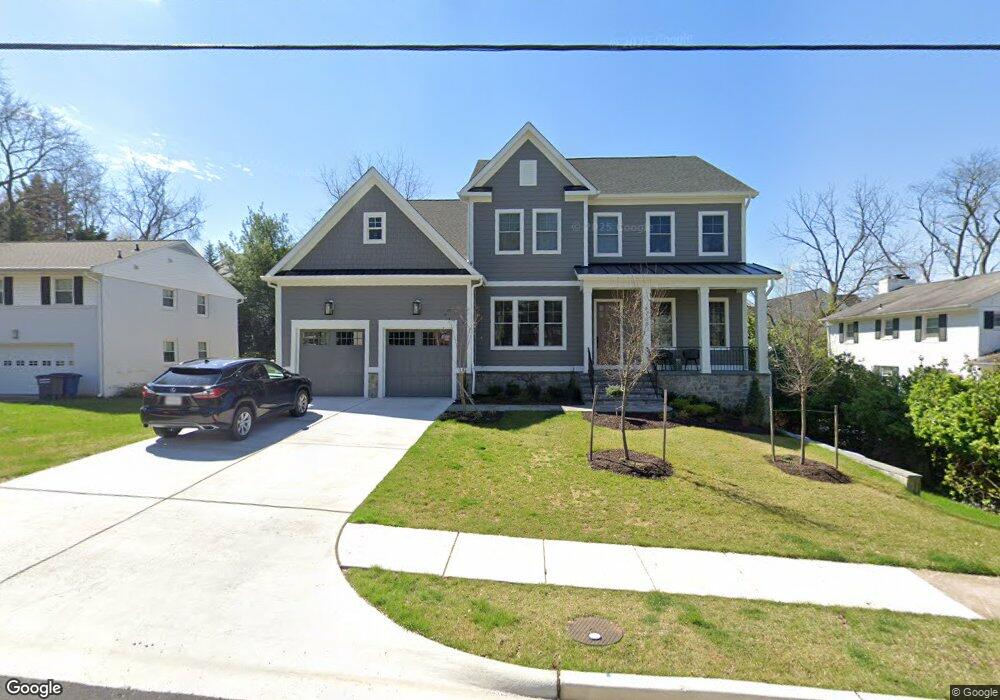
This home is located at 6225 Mori St, McLean, VA 22101 and is currently estimated at $2,339,466, approximately $589 per square foot. 6225 Mori St is a home located in Fairfax County with nearby schools including Chesterbrook Elementary School, Longfellow Middle School, and McLean High School.
Ownership History
We collect this data history from publicly available records. To have your information removed, we recommend requesting removal directly through your county’s website.
Purchase Details
Home Financials for this Owner
Home Financials are based on the most recent Mortgage that was taken out on this home.Home Values in the Area
Average Home Value in this Area
Purchase History
We collect this data history from publicly available records. To have your information removed, we recommend requesting removal directly through your county’s website.
| Date | Buyer | Sale Price | Title Company |
|---|---|---|---|
| $345,000 | -- |
Mortgage History
We collect this data history from publicly available records. To have your information removed, we recommend requesting removal directly through your county’s website.
| Date | Status | Borrower | Loan Amount |
|---|---|---|---|
| Open | $345,000 |
Tax History
We collect this data history from publicly available records. To have your information removed, we recommend requesting removal directly through your county’s website.
| Year | Tax Paid | Tax Assessment Tax Assessment Total Assessment is a certain percentage of the fair market value that is determined by local assessors to be the total taxable value of land and additions on the property. | Land | Improvement |
|---|---|---|---|---|
| 2025 | $24,337 | $2,166,220 | $645,000 | $1,521,220 |
| 2024 | $24,337 | $2,059,880 | $627,000 | $1,432,880 |
| 2023 | $22,614 | $1,963,880 | $531,000 | $1,432,880 |
| 2022 | $20,043 | $1,718,240 | $483,000 | $1,235,240 |
| 2021 | $5,954 | $497,630 | $431,000 | $66,630 |
| 2020 | $10,438 | $865,180 | $423,000 | $442,180 |
| 2019 | $9,992 | $828,170 | $403,000 | $425,170 |
| 2018 | $9,432 | $820,170 | $395,000 | $425,170 |
| 2017 | $9,471 | $799,920 | $395,000 | $404,920 |
| 2016 | $9,310 | $787,980 | $391,000 | $396,980 |
| 2015 | $8,718 | $765,420 | $380,000 | $385,420 |
| 2014 | $8,699 | $765,420 | $380,000 | $385,420 |
Map
- 6228 Nelway Dr
- 6161 Mori St
- 1650 Kirby Rd
- 6214 Loch Raven Dr
- 1436 Layman St
- 6210 Nethercombe Ct
- 0 Linway Terrace
- 6220 Hardy Dr
- 6179 Hardy Dr
- 1705 East Ave
- 6330 Cross St
- 6144 Chesterbrook Rd
- 1521 Forest Villa Ln
- 1712 East Ave
- 1513 Oakview Dr
- 1515 Brookhaven Dr
- 1800 Monza Rd
- 1438 Brookhaven Dr
- 1701 Briar Ridge Rd
- 6450 Old Chesterbrook Rd
- 6223 Mori St
- 1601 Walden Dr
- 6292 Columbus Hall Ct
- 1603 Walden Dr
- 6290 Columbus Hall Ct
- 6221 Mori St
- 6226 Mori St
- 1507 Walden Dr
- 6224 Mori St
- 1605 Walden Dr
- 6219 Mori St
- 6222 Mori St
- 6291 Columbus Hall Ct
- 1600 Walden Dr
- 1609 Walden Dr
- 1505 Walden Dr
- 1602 Walden Dr
- 6302 Mori St
- 6220 Mori St
- 1604 Walden Dr
Ask me questions while you tour the home.