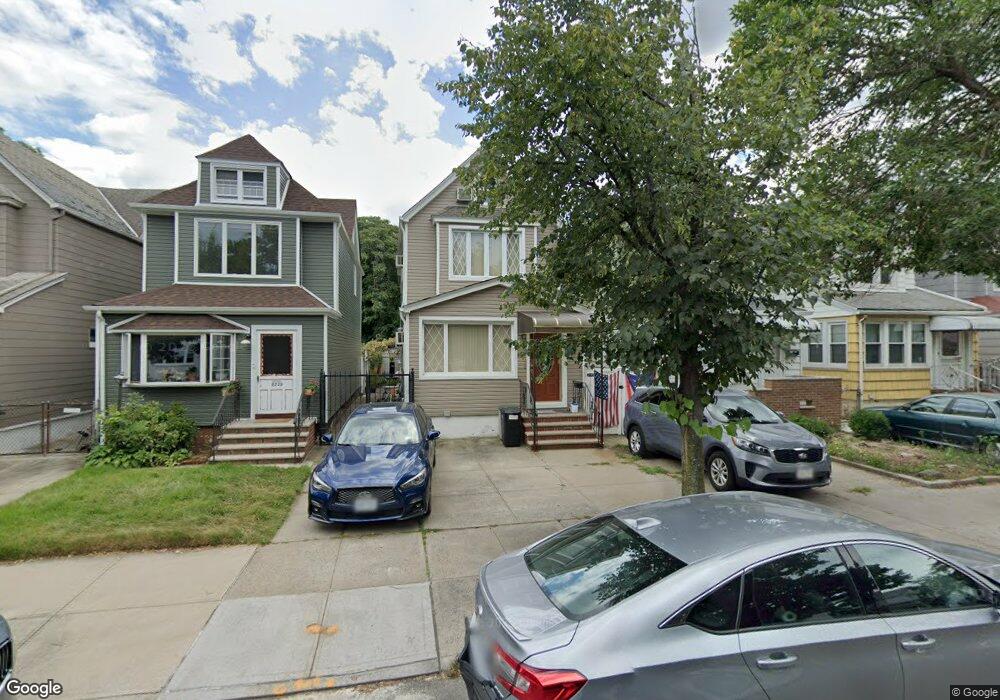
6226 80th Rd Ridgewood, NY 11385
Glendale NeighborhoodEstimated Value: $727,000 - $936,000
Studio
--
Bath
1,218
Sq Ft
$696/Sq Ft
Est. Value
About This Home
This home is located at 6226 80th Rd, Ridgewood, NY 11385 and is currently estimated at $848,186, approximately $696 per square foot. 6226 80th Rd is a home located in Queens County with nearby schools including P.S. 68 - Cambridge, Joseph F. Quinn Intermediate School 77, and Sacred Heart School.
Ownership History
Date
Name
Owned For
Owner Type
Purchase Details
Closed on
Jan 13, 2023
Sold by
Mangal Neila Wattie
Bought by
Mangal A A and Mangal K
Current Estimated Value
Purchase Details
Closed on
Dec 22, 1997
Sold by
Mccanney Michael J
Bought by
Singh Dhanraj M
Home Financials for this Owner
Home Financials are based on the most recent Mortgage that was taken out on this home.
Original Mortgage
$167,690
Interest Rate
7.09%
Mortgage Type
FHA
Purchase Details
Closed on
Mar 30, 1995
Sold by
Elbeyali Mohamed and Elbeyali Donna
Bought by
Mccanney Michael J
Create a Home Valuation Report for This Property
The Home Valuation Report is an in-depth analysis detailing your home's value as well as a comparison with similar homes in the area
Home Values in the Area
Average Home Value in this Area
Purchase History
We collect this data history from publicly available records. To have your information removed, we recommend requesting removal directly through your county’s website.
| Date | Buyer | Sale Price | Title Company |
|---|---|---|---|
| Mangal A A | -- | -- | |
| Singh Dhanraj M | $179,000 | -- | |
| Mccanney Michael J | $170,000 | The Title Guarantee Company |
Source: Public Records
Mortgage History
We collect this data history from publicly available records. To have your information removed, we recommend requesting removal directly through your county’s website.
| Date | Status | Borrower | Loan Amount |
|---|---|---|---|
| Previous Owner | Singh Dhanraj M | $167,690 |
Source: Public Records
Tax History
| Year | Tax Paid | Tax Assessment Tax Assessment Total Assessment is a certain percentage of the fair market value that is determined by local assessors to be the total taxable value of land and additions on the property. | Land | Improvement |
|---|---|---|---|---|
| 2026 | $7,679 | $39,652 | $11,635 | $28,017 |
| 2025 | $7,262 | $39,652 | $11,355 | $28,297 |
| 2024 | $7,274 | $37,555 | $12,879 | $24,676 |
| 2023 | $6,835 | $35,432 | $10,608 | $24,824 |
| 2022 | $6,468 | $46,500 | $15,000 | $31,500 |
| 2021 | $6,658 | $43,140 | $15,000 | $28,140 |
| 2020 | $6,698 | $42,300 | $15,000 | $27,300 |
| 2019 | $6,254 | $37,920 | $15,000 | $22,920 |
| 2018 | $5,721 | $29,527 | $12,640 | $16,887 |
| 2017 | $5,449 | $28,200 | $13,988 | $14,212 |
| 2016 | $5,195 | $28,200 | $13,988 | $14,212 |
| 2015 | $2,989 | $27,536 | $15,188 | $12,348 |
| 2014 | $2,989 | $26,080 | $15,011 | $11,069 |
Source: Public Records
Map
Nearby Homes
Your Personal Tour Guide
Ask me questions while you tour the home.