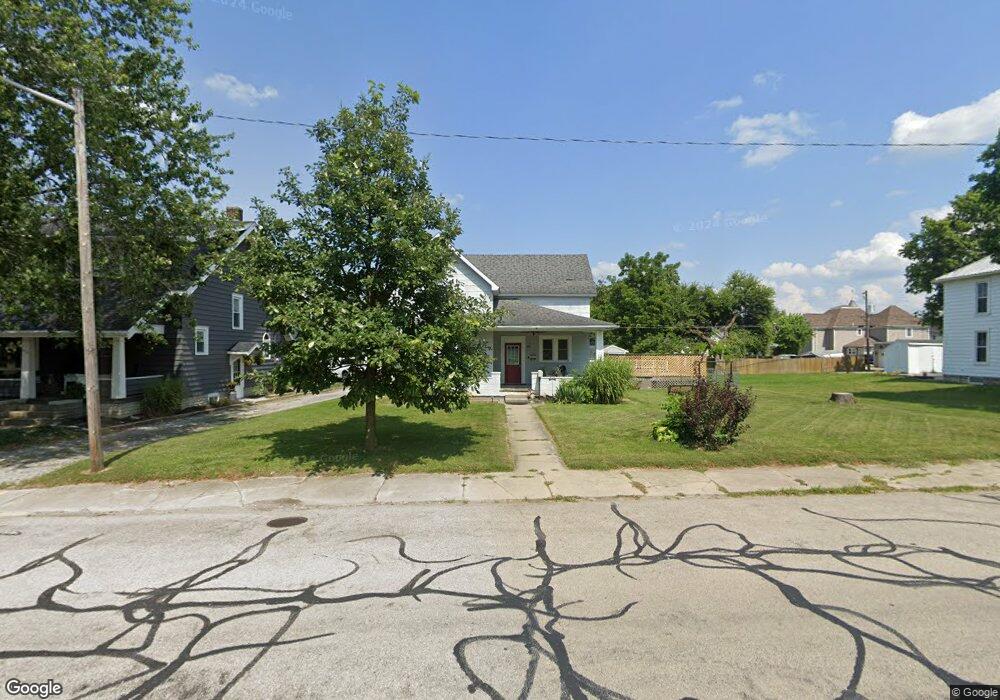
626 N 3rd St Decatur, IN 46733
Estimated Value: $176,000 - $199,822
3
Beds
2
Baths
2,728
Sq Ft
$69/Sq Ft
Est. Value
About This Home
This home is located at 626 N 3rd St, Decatur, IN 46733 and is currently estimated at $189,456, approximately $69 per square foot. 626 N 3rd St is a home located in Adams County with nearby schools including Southeast Elementary School, Bellmont Elementary School, and Bellmont Middle School.
Ownership History
Date
Name
Owned For
Owner Type
Purchase Details
Closed on
Jun 14, 2017
Sold by
Massoth Joel D
Bought by
Faurote Adam J
Current Estimated Value
Home Financials for this Owner
Home Financials are based on the most recent Mortgage that was taken out on this home.
Original Mortgage
$94,949
Outstanding Balance
$78,215
Interest Rate
4.02%
Mortgage Type
FHA
Estimated Equity
$111,241
Purchase Details
Closed on
Apr 14, 2009
Sold by
Kortenber Mitchell G
Bought by
Massoth Joel D
Home Financials for this Owner
Home Financials are based on the most recent Mortgage that was taken out on this home.
Original Mortgage
$82,478
Interest Rate
5.05%
Mortgage Type
FHA
Create a Home Valuation Report for This Property
The Home Valuation Report is an in-depth analysis detailing your home's value as well as a comparison with similar homes in the area
Home Values in the Area
Average Home Value in this Area
Purchase History
| Date | Buyer | Sale Price | Title Company |
|---|---|---|---|
| Faurote Adam J | -- | None Available | |
| Massoth Joel D | -- | -- |
Source: Public Records
Mortgage History
| Date | Status | Borrower | Loan Amount |
|---|---|---|---|
| Open | Faurote Adam J | $94,949 | |
| Previous Owner | Massoth Joel D | $82,478 |
Source: Public Records
Tax History
| Year | Tax Paid | Tax Assessment Tax Assessment Total Assessment is a certain percentage of the fair market value that is determined by local assessors to be the total taxable value of land and additions on the property. | Land | Improvement |
|---|---|---|---|---|
| 2025 | $1,346 | $149,600 | $21,700 | $127,900 |
| 2024 | $1,380 | $138,000 | $21,700 | $116,300 |
| 2023 | $1,318 | $128,800 | $21,700 | $107,100 |
| 2022 | $1,230 | $120,200 | $21,700 | $98,500 |
| 2021 | $1,139 | $111,100 | $20,900 | $90,200 |
| 2020 | $956 | $103,600 | $20,900 | $82,700 |
| 2019 | $846 | $99,000 | $20,900 | $78,100 |
| 2018 | $856 | $97,500 | $20,900 | $76,600 |
| 2017 | $771 | $97,400 | $20,500 | $76,900 |
| 2016 | $353 | $93,700 | $20,500 | $73,200 |
| 2014 | $557 | $88,700 | $20,500 | $68,200 |
| 2013 | $647 | $87,200 | $20,500 | $66,700 |
Source: Public Records
Map
Nearby Homes
- 333 N 1st St
- 221 N 3rd St
- 0 W US Hwy 224 Unit 202544637
- 922 N 11th St
- 110 S 4th St
- 418 W Jefferson St
- 127 N 9th St
- 209 S 5th St
- 607 W Jefferson St
- 323 S 1st St
- 347 S 3rd St
- 1024 Adams St
- 1214 E Bellmont Rd
- 1503 W Monroe St
- 715 Elm St
- 110 S 15th St
- 1539 Yorkshire Dr
- 122 S 15th St
- 816 Sycamore St
- 773 Sycamore St
Your Personal Tour Guide
Ask me questions while you tour the home.