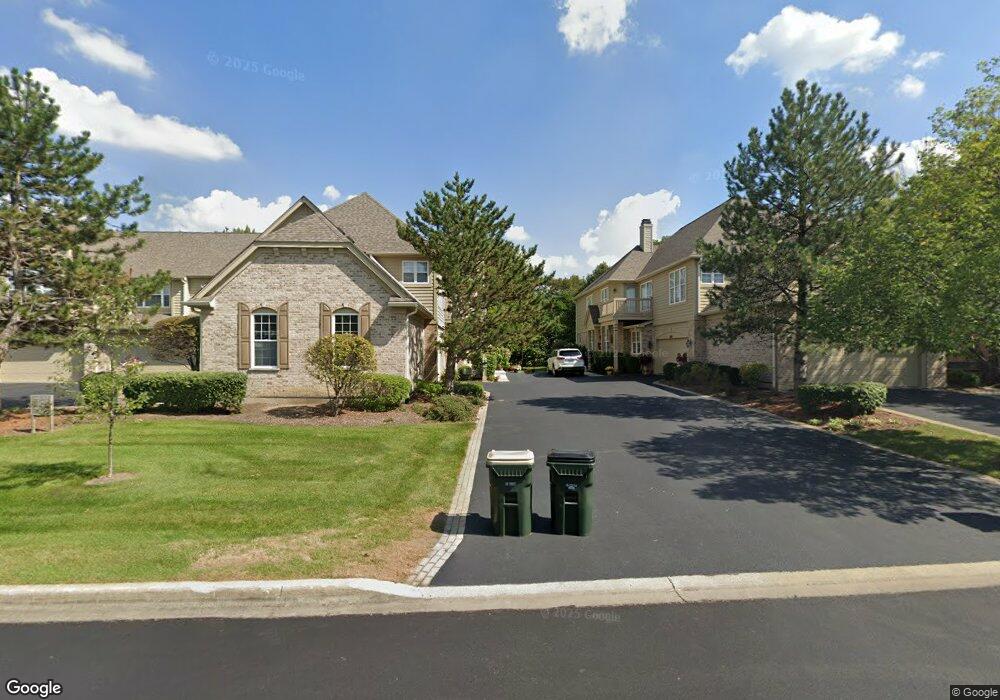
6271 Edgebrook Ln E La Grange, IL 60525
Estimated Value: $466,190 - $538,000
2
Beds
2
Baths
1,278
Sq Ft
$385/Sq Ft
Est. Value
About This Home
This home is located at 6271 Edgebrook Ln E, La Grange, IL 60525 and is currently estimated at $491,548, approximately $384 per square foot. 6271 Edgebrook Ln E is a home located in Cook County with nearby schools including Highlands Elementary School, Highlands Middle School, and Lyons Township High School.
Ownership History
Date
Name
Owned For
Owner Type
Purchase Details
Closed on
Jan 17, 2019
Sold by
Chicago Title Land Trust Co
Bought by
Mcgregor Neil E and Macgregor Cora Dell
Current Estimated Value
Purchase Details
Closed on
Dec 1, 2006
Sold by
Macgregor Neil E and Macgregor Cora D
Bought by
Chicago Title Land Trust Co and Trust #2871
Purchase Details
Closed on
Aug 28, 2006
Sold by
Weathered Virginia A
Bought by
Macgregor Neil E and Macgregor Cora D
Home Financials for this Owner
Home Financials are based on the most recent Mortgage that was taken out on this home.
Original Mortgage
$100,000
Interest Rate
6.41%
Mortgage Type
Unknown
Purchase Details
Closed on
Mar 10, 1999
Sold by
Chicago Title Land Trust Company
Bought by
Weathered Virginia A and Virginia A Weathered Trust
Purchase Details
Closed on
Apr 1, 1998
Sold by
Donven Homes Inc
Bought by
Chicago Trust Co and Trust #1099934
Create a Home Valuation Report for This Property
The Home Valuation Report is an in-depth analysis detailing your home's value as well as a comparison with similar homes in the area
Home Values in the Area
Average Home Value in this Area
Purchase History
We collect this data history from publicly available records. To have your information removed, we recommend requesting removal directly through your county’s website.
| Date | Buyer | Sale Price | Title Company |
|---|---|---|---|
| Mcgregor Neil E | -- | Chicago Title Land Trust Com | |
| Chicago Title Land Trust Co | -- | Attorneys Title Guaranty Fun | |
| Macgregor Neil E | $420,000 | Attorneys Title Guaranty Fun | |
| Weathered Virginia A | -- | -- | |
| Chicago Trust Co | $239,500 | -- |
Source: Public Records
Mortgage History
We collect this data history from publicly available records. To have your information removed, we recommend requesting removal directly through your county’s website.
| Date | Status | Borrower | Loan Amount |
|---|---|---|---|
| Previous Owner | Macgregor Neil E | $100,000 |
Source: Public Records
Tax History
| Year | Tax Paid | Tax Assessment Tax Assessment Total Assessment is a certain percentage of the fair market value that is determined by local assessors to be the total taxable value of land and additions on the property. | Land | Improvement |
|---|---|---|---|---|
| 2025 | $8,518 | $37,002 | $4,154 | $32,848 |
| 2024 | $8,518 | $37,002 | $4,154 | $32,848 |
| 2023 | $8,475 | $37,002 | $4,154 | $32,848 |
| 2022 | $8,475 | $30,905 | $3,610 | $27,295 |
| 2021 | $8,055 | $30,905 | $3,610 | $27,295 |
| 2020 | $8,009 | $31,464 | $3,610 | $27,854 |
| 2019 | $7,343 | $34,924 | $3,290 | $31,634 |
| 2018 | $8,752 | $34,924 | $3,290 | $31,634 |
| 2017 | $7,028 | $34,924 | $3,290 | $31,634 |
| 2016 | $7,723 | $28,584 | $2,875 | $25,709 |
| 2015 | $7,602 | $28,584 | $2,875 | $25,709 |
| 2014 | $7,498 | $28,584 | $2,875 | $25,709 |
| 2013 | $7,397 | $29,661 | $2,875 | $26,786 |
Source: Public Records
Map
Nearby Homes
- 11025 Edgebrook Ln
- 170 Cascade Dr
- 116 Cascade Dr
- 11171 Edgebrook Ln
- 1738 60th St
- 6100 Timber Ridge Ct
- 7445 Willow Springs Rd
- 905 Hickory Dr
- 1045 Hickory Dr
- 11407 Hiawatha Ln
- 6820 Joliet Rd Unit 11
- 1102 White Pine Ln
- 5916 Parkview Dr
- 6441 Blackhawk Trail
- 6102 Burr Oak Dr
- 1333 W 59th St
- 6100 Burr Oak Dr
- 5903 Timber Trails (Lot 54) Blvd
- 1113 Hawthorn Ln
- 1115 Hawthorn Ln
- 11021 Edgebrook Ln
- 11029 Edgebrook Ln
- 11031 Edgebrook Ln
- 11013 Edgebrook Ln
- 11017 Edgebrook Ln
- 11009 Edgebrook Ln
- 11039 Edgebrook Ln
- 11035 Edgebrook Ln
- 11005 Edgebrook Ln
- 11043 Edgebrook Ln
- 6287 Edgebrook Ln E
- 6289 Edgebrook Ln E
- 6287 Edgebrook Ln E Unit B
- 6284 Edgebrook Ln E
- 11001 Edgebrook Ln
- 11047 Edgebrook Ln
- 6285 Edgebrook Ln E
- 191 Cascade Dr
- 6283 Edgebrook Ln E Unit C
- 6283 Edgebrook Ln E
Your Personal Tour Guide
Ask me questions while you tour the home.