628 Burns Ct Westerville, OH 43081
Estimated Value: $341,000 - $375,912
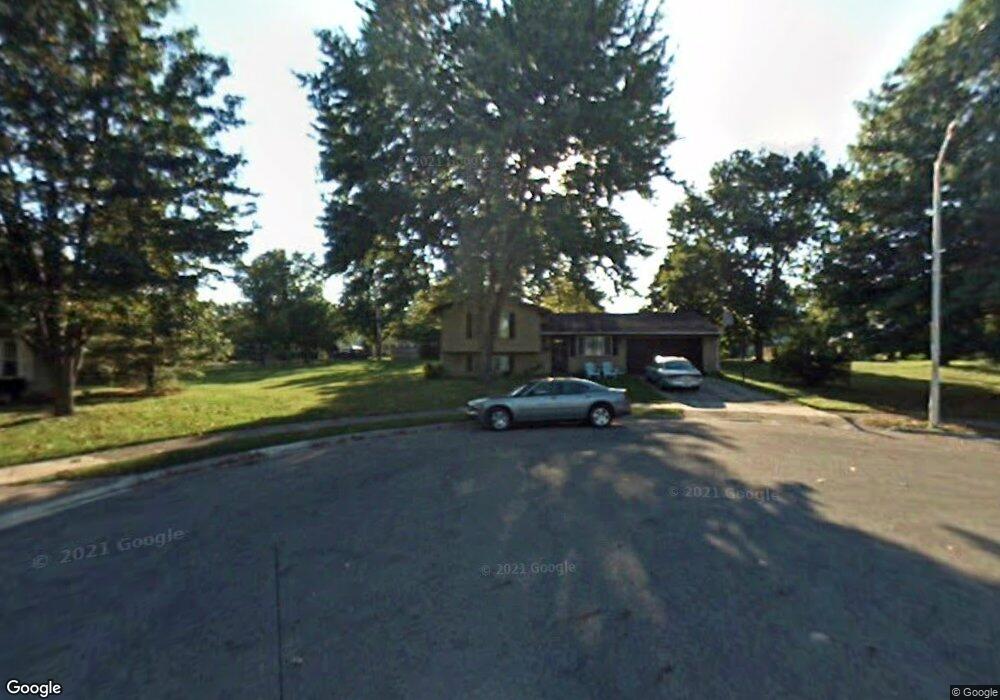
About This Home
This home is located at 628 Burns Ct, Westerville, OH 43081 and is currently estimated at $360,728, approximately $261 per square foot. 628 Burns Ct is a home located in Franklin County with nearby schools including Robert Frost Elementary School, Heritage Middle School, and Westerville-North High School.
Ownership History
We collect this data history from publicly available records. To have your information removed, we recommend requesting removal directly through your county’s website.
Purchase Details
Home Financials for this Owner
Home Financials are based on the most recent Mortgage that was taken out on this home.Purchase Details
Home Values in the Area
Average Home Value in this Area
Purchase History
We collect this data history from publicly available records. To have your information removed, we recommend requesting removal directly through your county’s website.
| Date | Buyer | Sale Price | Title Company |
|---|---|---|---|
| $120,000 | None Available | ||
| -- | -- |
Mortgage History
We collect this data history from publicly available records. To have your information removed, we recommend requesting removal directly through your county’s website.
| Date | Status | Borrower | Loan Amount |
|---|---|---|---|
| Open | $108,000 |
Tax History
We collect this data history from publicly available records. To have your information removed, we recommend requesting removal directly through your county’s website.
| Year | Tax Paid | Tax Assessment Tax Assessment Total Assessment is a certain percentage of the fair market value that is determined by local assessors to be the total taxable value of land and additions on the property. | Land | Improvement |
|---|---|---|---|---|
| 2025 | $6,286 | $110,610 | $32,730 | $77,880 |
| 2024 | $6,286 | $110,610 | $32,730 | $77,880 |
| 2023 | $6,153 | $110,600 | $32,725 | $77,875 |
| 2022 | $5,506 | $75,570 | $15,750 | $59,820 |
| 2021 | $5,552 | $75,570 | $15,750 | $59,820 |
| 2020 | $5,536 | $75,570 | $15,750 | $59,820 |
| 2019 | $4,707 | $60,660 | $15,750 | $44,910 |
| 2018 | $3,712 | $41,020 | $15,750 | $25,270 |
| 2017 | $3,217 | $41,020 | $15,750 | $25,270 |
| 2016 | $4,439 | $51,520 | $17,080 | $34,440 |
| 2015 | $4,303 | $51,520 | $17,080 | $34,440 |
| 2014 | $4,306 | $51,520 | $17,080 | $34,440 |
| 2013 | $1,991 | $49,070 | $16,275 | $32,795 |
Map
- 622 Michael Ave
- 536 Michael Ave
- 80 Ash Ct
- 715 Sugar Ct
- 44 N Spring Rd
- 565 Peach St
- 391 Burns Dr N
- 793 Collingwood Dr
- 106 Nicole Dr
- 174 Nottingham Ct Unit 174
- 192 Buckeye Ct
- 344 Eastwood Ave
- 328 Myrtle Dr Unit Lot 5
- 348 Myrtle Dr Unit Lot 10
- 337 Myrtle Dr Unit Lot 2
- 334 Myrtle Dr Unit Lot 7
- 342 Myrtle Dr Unit Lot 8
- 344 Myrtle Dr Unit Lot 9
- 27 Nicole Dr
- 407 Canmore Ct
Ask me questions while you tour the home.