6284 Starvue Dr Cincinnati, OH 45248
Estimated Value: $276,000 - $353,000
4
Beds
3
Baths
1,359
Sq Ft
$224/Sq Ft
Est. Value
About This Home
This home is located at 6284 Starvue Dr, Cincinnati, OH 45248 and is currently estimated at $304,320, approximately $223 per square foot. 6284 Starvue Dr is a home located in Hamilton County with nearby schools including John Foster Dulles Elementary School, Rapid Run Middle School, and Oak Hills High School.
Ownership History
Date
Name
Owned For
Owner Type
Purchase Details
Closed on
Apr 27, 2007
Sold by
Kershaw Brian D and Kershaw Lisa P
Bought by
Diersing Sarah E and Diersing Jeffrey
Current Estimated Value
Home Financials for this Owner
Home Financials are based on the most recent Mortgage that was taken out on this home.
Original Mortgage
$218,400
Outstanding Balance
$130,443
Interest Rate
6.2%
Mortgage Type
Unknown
Estimated Equity
$173,877
Purchase Details
Closed on
Mar 4, 1994
Sold by
Zang Joseph
Bought by
Fox James C and Fox Katherine A
Home Financials for this Owner
Home Financials are based on the most recent Mortgage that was taken out on this home.
Original Mortgage
$135,000
Interest Rate
7.04%
Create a Home Valuation Report for This Property
The Home Valuation Report is an in-depth analysis detailing your home's value as well as a comparison with similar homes in the area
Home Values in the Area
Average Home Value in this Area
Purchase History
| Date | Buyer | Sale Price | Title Company |
|---|---|---|---|
| Diersing Sarah E | $236,000 | First Title Inc | |
| Fox James C | -- | -- |
Source: Public Records
Mortgage History
| Date | Status | Borrower | Loan Amount |
|---|---|---|---|
| Open | Diersing Sarah E | $218,400 | |
| Closed | Fox James C | $135,000 |
Source: Public Records
Tax History
| Year | Tax Paid | Tax Assessment Tax Assessment Total Assessment is a certain percentage of the fair market value that is determined by local assessors to be the total taxable value of land and additions on the property. | Land | Improvement |
|---|---|---|---|---|
| 2025 | $3,904 | $74,908 | $13,899 | $61,009 |
| 2023 | $3,811 | $74,908 | $13,899 | $61,009 |
| 2022 | $3,739 | $62,304 | $13,031 | $49,273 |
| 2021 | $3,441 | $62,304 | $13,031 | $49,273 |
| 2020 | $3,401 | $62,304 | $13,031 | $49,273 |
| 2019 | $3,329 | $55,629 | $11,634 | $43,995 |
| 2018 | $3,333 | $55,629 | $11,634 | $43,995 |
| 2017 | $3,142 | $55,629 | $11,634 | $43,995 |
| 2016 | $3,403 | $60,194 | $11,519 | $48,675 |
| 2015 | $3,432 | $60,194 | $11,519 | $48,675 |
| 2014 | $3,437 | $60,194 | $11,519 | $48,675 |
| 2013 | $3,243 | $60,799 | $11,634 | $49,165 |
Source: Public Records
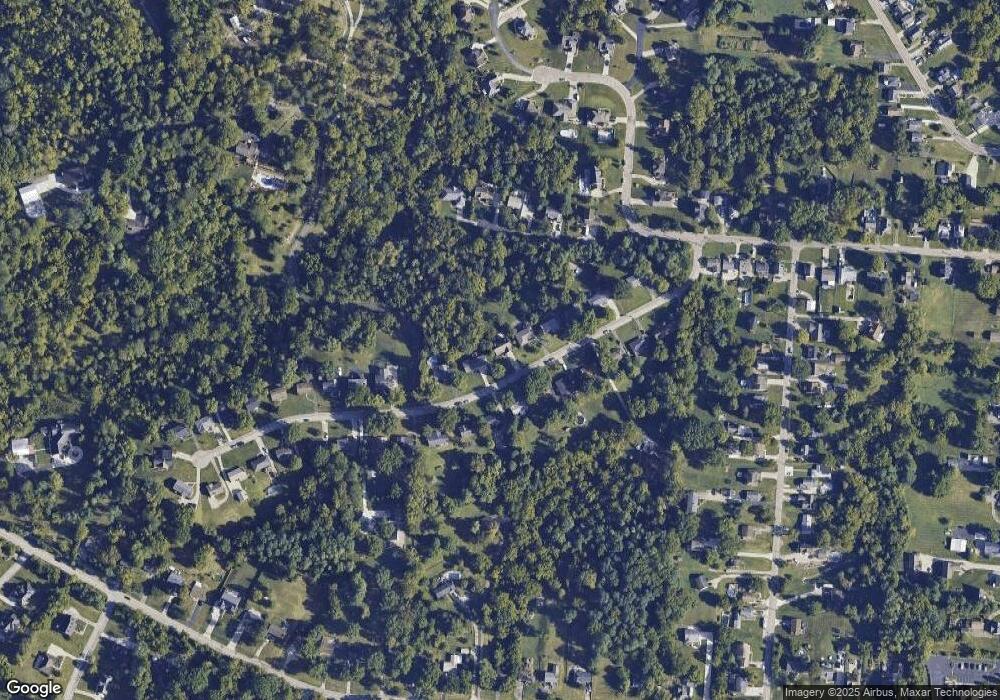
Map
Nearby Homes
- 6203 Taylor Rd
- 3758 Ebenezer Rd
- 2 Ebenezer Rd
- 1 Hutchinson Rd
- 4181 Hutchinson Rd
- 6560 Springmyer Dr
- 5775 Irwin Dr
- 3986 Trailside Dr
- 3994 Trailside Dr
- 4008 Trailside Dr
- 5712 Hannah's Ridge
- 6684 Powner Farm Dr
- 3589 Eyrich Rd
- 4017 Trailside Dr
- 4483 Ebenezer Rd
- 3105 Laurel Hill Ln
- 3108 Laurel Hill Ln
- 4033 Trailside Dr
- 6335 Kaitlyn Ct
- 3433 Tolland Ct
- 6278 Starvue Dr
- 6288 Starvue Dr
- 6274 Starvue Dr
- 6298 Starvue Dr
- 6281 Starvue Dr
- 6266 Starvue Dr
- 6285 Starvue Dr
- 6275 Starvue Dr
- 6291 Starvue Dr
- 6271 Starvue Dr
- 6295 Starvue Dr
- 6299 Starvue Dr
- 6258 Starvue Dr
- 6316 Starvue Dr
- 6261 Starvue Dr
- 6307 Starvue Dr
- 6245 Berauer Rd
- 6243 Berauer Rd
- 6324 Starvue Dr
- 6255 Starvue Dr
Your Personal Tour Guide
Ask me questions while you tour the home.