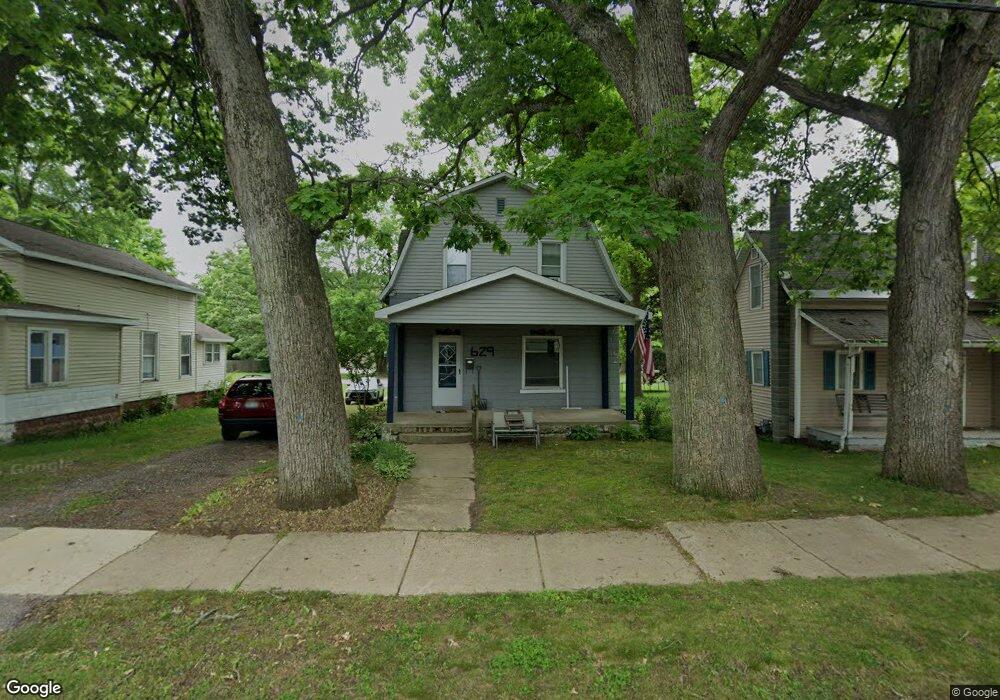
629 Ely St Allegan, MI 49010
Estimated Value: $183,000 - $221,000
Studio
2
Baths
1,375
Sq Ft
$149/Sq Ft
Est. Value
About This Home
This home is located at 629 Ely St, Allegan, MI 49010 and is currently estimated at $204,357, approximately $148 per square foot. 629 Ely St is a home located in Allegan County with nearby schools including West Ward Elementary School, L.E. White Middle School, and Allegan High School.
Ownership History
Date
Name
Owned For
Owner Type
Purchase Details
Closed on
Mar 20, 2024
Sold by
Heintzelman Gary
Bought by
Heintzelman Travis and Heintzelman Gary
Current Estimated Value
Purchase Details
Closed on
Dec 17, 1998
Bought by
Black Faye I
Purchase Details
Closed on
Jul 18, 1998
Sold by
Black Faye I
Bought by
Heintzelman Gary
Purchase Details
Closed on
Jul 7, 1998
Sold by
Black Faye Irene
Bought by
Heintzelman Gary
Purchase Details
Closed on
Jul 18, 1996
Sold by
Black Faye I
Bought by
First National Acceptance Co
Purchase Details
Closed on
Mar 15, 1996
Sold by
Foster John C and Foster Wf
Bought by
Childs-Peck Jackqaline D
Create a Home Valuation Report for This Property
The Home Valuation Report is an in-depth analysis detailing your home's value as well as a comparison with similar homes in the area
Home Values in the Area
Average Home Value in this Area
Purchase History
We collect this data history from publicly available records. To have your information removed, we recommend requesting removal directly through your county’s website.
| Date | Buyer | Sale Price | Title Company |
|---|---|---|---|
| Heintzelman Travis | -- | None Listed On Document | |
| Heintzelman Travis | -- | None Listed On Document | |
| Black Faye I | -- | -- | |
| Heintzelman Gary | $36,000 | -- | |
| Heintzelman Gary | $36,000 | -- | |
| First National Acceptance Co | -- | -- | |
| Childs-Peck Jackqaline D | -- | -- | |
| Childs-Peck Jackqaline D | -- | -- | |
| Black Faye I | $30,000 | -- |
Source: Public Records
Tax History
| Year | Tax Paid | Tax Assessment Tax Assessment Total Assessment is a certain percentage of the fair market value that is determined by local assessors to be the total taxable value of land and additions on the property. | Land | Improvement |
|---|---|---|---|---|
| 2025 | $1,742 | $66,200 | $11,300 | $54,900 |
| 2024 | $1,584 | $57,200 | $9,800 | $47,400 |
| 2023 | $1,636 | $49,000 | $9,300 | $39,700 |
| 2022 | $1,584 | $43,000 | $7,700 | $35,300 |
| 2021 | $1,520 | $41,700 | $6,100 | $35,600 |
| 2020 | $1,498 | $42,200 | $5,600 | $36,600 |
| 2019 | $1,464 | $35,400 | $5,200 | $30,200 |
| 2018 | $1,407 | $28,600 | $5,000 | $23,600 |
| 2017 | $0 | $26,900 | $4,200 | $22,700 |
| 2016 | $0 | $21,700 | $3,500 | $18,200 |
| 2015 | -- | $21,700 | $3,500 | $18,200 |
| 2014 | -- | $23,100 | $3,500 | $19,600 |
| 2013 | $1,761 | $24,600 | $3,500 | $21,100 |
Source: Public Records
Map
Nearby Homes
Your Personal Tour Guide
Ask me questions while you tour the home.