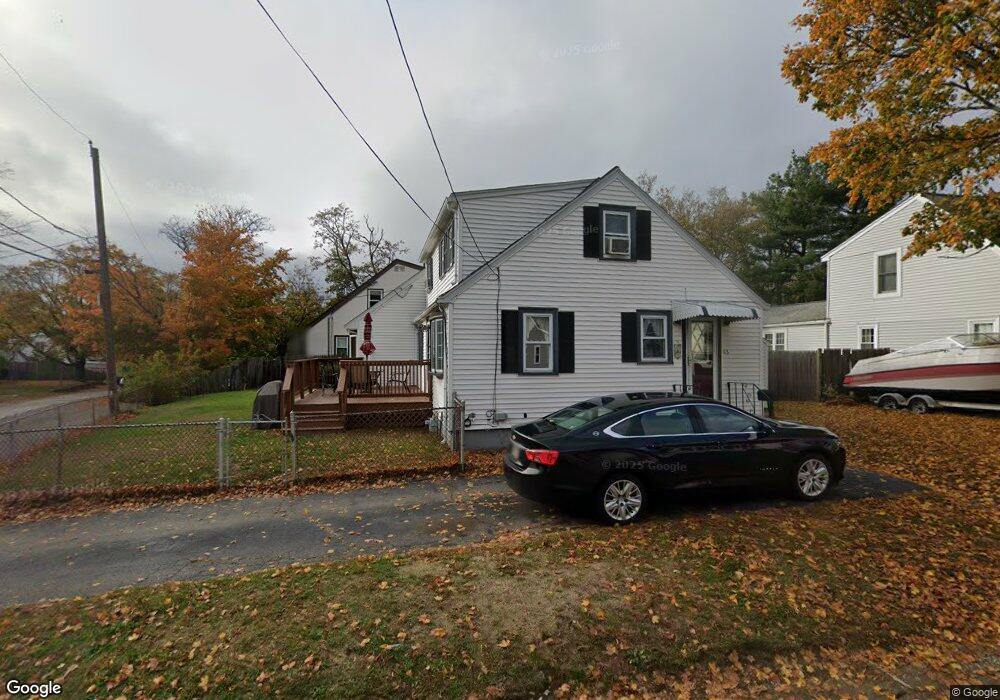
63 Bluff Rd North Weymouth, MA 02191
North Weymouth NeighborhoodEstimated Value: $644,734 - $751,000
4
Beds
2
Baths
1,679
Sq Ft
$413/Sq Ft
Est. Value
About This Home
This home is located at 63 Bluff Rd, North Weymouth, MA 02191 and is currently estimated at $692,934, approximately $412 per square foot. 63 Bluff Rd is a home located in Norfolk County with nearby schools including Wessagusset Elementary School, Abigail Adams Middle School, and Weymouth Middle School Chapman.
Ownership History
Date
Name
Owned For
Owner Type
Purchase Details
Closed on
Jan 28, 1999
Sold by
Gilmartin Daniel J and Gilmartin Donna L
Bought by
Presente Michael A and Presente Norine L
Current Estimated Value
Purchase Details
Closed on
Apr 22, 1994
Sold by
Morris Barry S and Morris Mary L
Bought by
Gilmartin Daniel S and Gilmartins Donna L
Create a Home Valuation Report for This Property
The Home Valuation Report is an in-depth analysis detailing your home's value as well as a comparison with similar homes in the area
Home Values in the Area
Average Home Value in this Area
Purchase History
| Date | Buyer | Sale Price | Title Company |
|---|---|---|---|
| Presente Michael A | $172,850 | -- | |
| Gilmartin Daniel S | $127,000 | -- |
Source: Public Records
Mortgage History
| Date | Status | Borrower | Loan Amount |
|---|---|---|---|
| Open | Gilmartin Daniel S | $243,700 | |
| Closed | Gilmartin Daniel S | $182,000 |
Source: Public Records
Tax History
| Year | Tax Paid | Tax Assessment Tax Assessment Total Assessment is a certain percentage of the fair market value that is determined by local assessors to be the total taxable value of land and additions on the property. | Land | Improvement |
|---|---|---|---|---|
| 2025 | $5,666 | $561,000 | $210,700 | $350,300 |
| 2024 | $5,489 | $534,500 | $200,700 | $333,800 |
| 2023 | $5,175 | $495,200 | $185,800 | $309,400 |
| 2022 | $5,032 | $439,100 | $172,000 | $267,100 |
| 2021 | $4,820 | $410,600 | $172,000 | $238,600 |
| 2020 | $4,645 | $389,700 | $172,000 | $217,700 |
| 2019 | $4,568 | $376,900 | $165,400 | $211,500 |
| 2018 | $4,498 | $359,800 | $157,500 | $202,300 |
| 2017 | $4,339 | $338,700 | $143,200 | $195,500 |
| 2016 | $4,204 | $328,400 | $137,700 | $190,700 |
| 2015 | $3,963 | $307,200 | $131,200 | $176,000 |
| 2014 | $3,705 | $278,600 | $122,100 | $156,500 |
Source: Public Records
Map
Nearby Homes
- 38 Saunders St
- 11 Birchbrow Ave
- 85 Kings Cove Beach Rd
- 104 Kings Cove Beach Rd
- 90 Sea St Unit 204
- 149 Glenrose Ave
- 11 Grand View Rd
- 82-84 Sea St
- 129 Audubon Ave
- 81 Wessagussett Rd
- 19-21 Bursley Rd
- 62 Lawn Ave
- 14 Crescent Rd
- 67 Trefton Dr
- 70 Biscayne Ave
- 67 Cleverly Ct
- 70 Colonial Rd
- 87 Arborway Dr
- 86 E Howard St Unit 107
- 80 Manzanetta Ave
Your Personal Tour Guide
Ask me questions while you tour the home.