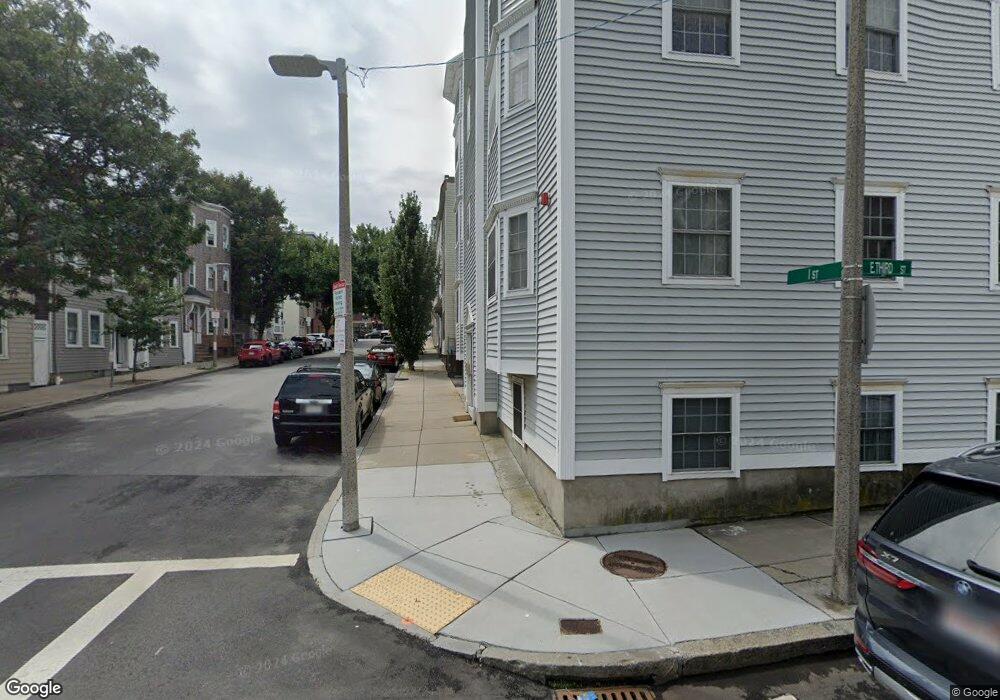
63 I St Boston, MA 02127
South Boston NeighborhoodEstimated Value: $1,139,000 - $1,456,000
About This Home
"Step into a haven of comfort and style as this inviting apartment wraps you in a warm embrace of plush furnishings and soft ambient lighting. Every corner is a sanctuary of relaxation, where the cozy textures and soothing color palette create an atmosphere that feels like a perpetual hug, making it the perfect retreat after a long day.
" 249526 977
Ownership History
Purchase Details
Purchase Details
Purchase Details
Home Values in the Area
Average Home Value in this Area
Purchase History
We collect this data history from publicly available records. To have your information removed, we recommend requesting removal directly through your county’s website.
| Date | Buyer | Sale Price | Title Company |
|---|---|---|---|
| Doyne Dermot M | $145,000 | -- | |
| Meier Robert T | $93,000 | -- | |
| Fhlmc | $147,000 | -- | |
| Fhlmc | $147,000 | -- |
Mortgage History
We collect this data history from publicly available records. To have your information removed, we recommend requesting removal directly through your county’s website.
| Date | Status | Borrower | Loan Amount |
|---|---|---|---|
| Open | Fhlmc | $385,000 | |
| Closed | Fhlmc | $130,000 |
Property History
| Date | Event | Price | List to Sale | Price per Sq Ft |
|---|---|---|---|---|
| 10/08/2024 10/08/24 | Off Market | $3,200 | -- | -- |
| 10/08/2024 10/08/24 | Off Market | $3,200 | -- | -- |
| 09/01/2024 09/01/24 | For Rent | $3,200 | 0.0% | -- |
| 08/31/2024 08/31/24 | For Rent | $3,200 | -- | -- |
Tax History
| Year | Tax Paid | Tax Assessment Tax Assessment Total Assessment is a certain percentage of the fair market value that is determined by local assessors to be the total taxable value of land and additions on the property. | Land | Improvement |
|---|---|---|---|---|
| 2025 | $14,565 | $1,257,800 | $339,900 | $917,900 |
| 2024 | $13,807 | $1,266,700 | $316,100 | $950,600 |
| 2023 | $12,597 | $1,172,900 | $292,700 | $880,200 |
| 2022 | $11,601 | $1,066,300 | $266,100 | $800,200 |
| 2021 | $11,377 | $1,066,300 | $266,100 | $800,200 |
| 2020 | $9,599 | $909,000 | $281,100 | $627,900 |
| 2019 | $8,714 | $826,800 | $200,500 | $626,300 |
| 2018 | $8,096 | $772,500 | $200,500 | $572,000 |
| 2017 | $7,788 | $735,400 | $200,500 | $534,900 |
| 2016 | $7,033 | $639,400 | $200,500 | $438,900 |
| 2015 | $6,133 | $506,400 | $161,700 | $344,700 |
| 2014 | $6,012 | $477,900 | $161,700 | $316,200 |
Map
- 485 E 3rd St
- 614 E Broadway Unit 616
- 578 E Broadway Unit 1
- 616 E 4th St Unit 105
- 165 Emerson St
- 561 E Broadway
- 561 E Broadway Unit 561
- 11 Emmet St
- 39 Emerson St
- 531-533 E 2nd St Unit 201
- 550 E 3rd St
- 1 Schrepel Place
- 523 E 2nd St Unit 5
- 554 E 4th St Unit 1B
- 519 E 2nd St Unit 403
- 191 K St Unit pk 7
- 507 E 5th St
- 515 E 1st St Unit 8
- 529 E Broadway Unit 4
- 133 I St Unit 3
- 120 Emerson St Unit 6
- 120 Emerson St Unit 4
- 120 Emerson St Unit 2
- 120 Emerson St Unit 1
- 120 Emerson St Unit 5
- 120 Emerson St Unit 3
- 120 Emerson St
- 130 Emerson St Unit 42
- 130 Emerson St Unit 40
- 130 Emerson St Unit 32
- 130 Emerson St Unit 30
- 130 Emerson St Unit 22
- 130 Emerson St Unit 20
- 130 Emerson St Unit 10
- 130 Emerson St Unit 3D
- 130 Emerson St
- 132 Emerson St Unit 43
- 132 Emerson St Unit 41
- 132 Emerson St Unit 33
- 132 Emerson St Unit 31
Ask me questions while you tour the home.