63 Meyer St Roslindale, MA 02131
Jamaica Plain NeighborhoodEstimated Value: $504,000 - $681,000
About This Home
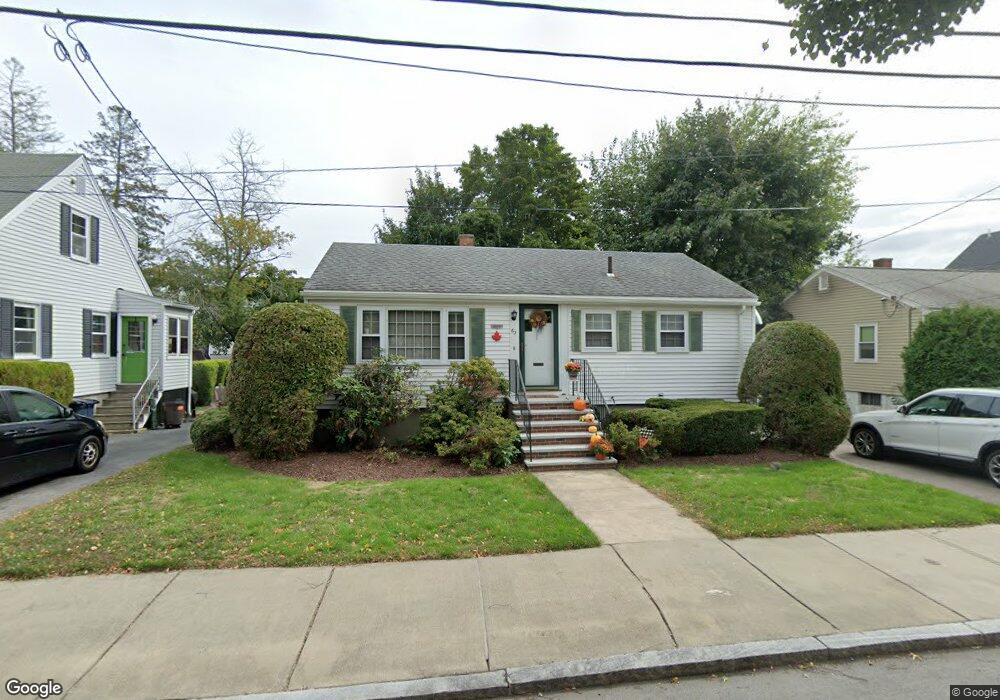
This home is located at 63 Meyer St, Roslindale, MA 02131 and is currently estimated at $592,943, approximately $686 per square foot. 63 Meyer St is a home located in Suffolk County with nearby schools including Brooke Charter School Roslindale and St. Clare High School.
Ownership History
We collect this data history from publicly available records. To have your information removed, we recommend requesting removal directly through your county’s website.
Purchase Details
Home Financials for this Owner
Home Financials are based on the most recent Mortgage that was taken out on this home.Home Values in the Area
Average Home Value in this Area
Purchase History
We collect this data history from publicly available records. To have your information removed, we recommend requesting removal directly through your county’s website.
| Date | Buyer | Sale Price | Title Company |
|---|---|---|---|
| $125,000 | -- |
Mortgage History
We collect this data history from publicly available records. To have your information removed, we recommend requesting removal directly through your county’s website.
| Date | Status | Borrower | Loan Amount |
|---|---|---|---|
| Open | $40,000 | ||
| Closed | $18,500 | ||
| Closed | $80,000 |
Tax History
We collect this data history from publicly available records. To have your information removed, we recommend requesting removal directly through your county’s website.
| Year | Tax Paid | Tax Assessment Tax Assessment Total Assessment is a certain percentage of the fair market value that is determined by local assessors to be the total taxable value of land and additions on the property. | Land | Improvement |
|---|---|---|---|---|
| 2025 | $5,836 | $504,000 | $190,100 | $313,900 |
| 2024 | $5,267 | $483,200 | $195,000 | $288,200 |
| 2023 | $4,849 | $451,500 | $182,200 | $269,300 |
| 2022 | $4,505 | $414,100 | $167,100 | $247,000 |
| 2021 | $4,289 | $402,000 | $162,200 | $239,800 |
| 2020 | $3,761 | $356,200 | $164,000 | $192,200 |
| 2019 | $3,560 | $337,800 | $138,500 | $199,300 |
| 2018 | $3,161 | $301,600 | $138,500 | $163,100 |
| 2017 | $3,133 | $295,800 | $138,500 | $157,300 |
| 2016 | $3,190 | $290,000 | $138,500 | $151,500 |
| 2015 | $3,526 | $291,200 | $155,600 | $135,600 |
| 2014 | $3,208 | $255,000 | $155,600 | $99,400 |
Map
- 167 Bourne St
- 59 Wyvern St
- 94 Florian St
- 26 Neponset Ave Unit 26
- 26 Neponset Ave
- 18 Southbourne Rd
- 602 Canterbury St Unit 9
- 602 Canterbury St Unit 10
- 428-430 Hyde Park Ave
- 596 American Legion Hwy Unit 3
- 6 Dellmore Rd Unit 3
- 31 Harrison St Unit B
- 41 Mount Hope St
- 224 Florence St Unit 3
- 737 American Legion Hwy
- 55 Walk Hill St Unit 2
- 25 Granfield Ave Unit 2
- 18 Granfield Ave Unit 18-3
- 101-103 Wachusett St Unit 1
- 139 Florence St Unit 139
Ask me questions while you tour the home.